MULTIMEDIA
Video: Greenland ice loss 2002-2016
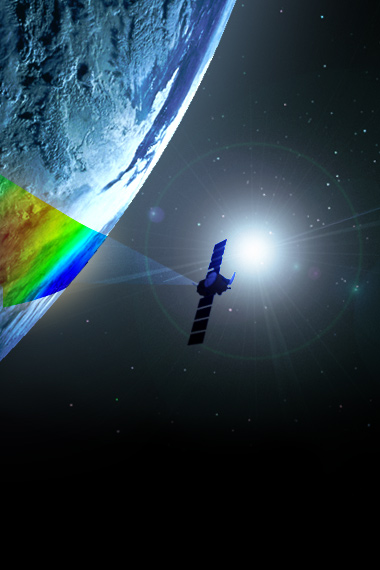
The mass of the Greenland ice sheet has rapidly declined in the last several years due to surface melting and iceberg calving. Research based on observations from the NASA/German Aerospace Center’s twin Gravity Recovery and Climate Experiment (GRACE) satellites indicates that between 2002 and 2016, Greenland shed approximately 280 gigatons of ice per year, causing global sea level to rise by 0.03 inches (0.8 millimeters) per year.
These images, created from GRACE data, show changes in Greenland ice mass since 2002. Orange and red shades indicate areas that lost ice mass, while light blue shades indicate areas that gained ice mass. White indicates areas where there has been very little or no change in ice mass since 2002. In general, higher-elevation areas near the center of Greenland experienced little to no change, while lower-elevation and coastal areas experienced up to 13.1 feet (4 meters) of ice mass loss (expressed in equivalent-water-height; dark red) over a 14-year period. The largest mass decreases of up to 11.8 inches (30 centimeters (equivalent-water-height) per year occurred along the West Greenland coast. The average flow lines (grey; created from satellite radar interferometry) of Greenland’s ice converge into the locations of prominent outlet glaciers, and coincide with areas of high mass loss.


.jpg?disposition=inline)