NASA
Global Climate Change
Vital Signs of the Planet
Skip Navigation
menu close modal

MULTIMEDIA

Quiz: Our home planet
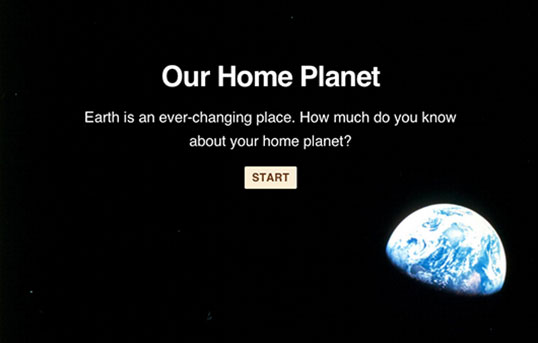
Quiz: Our home planet

Earth is an ever-changing place. How much do you know about your home planet? Take our quiz.

Browse our collection of climate-related quizzes here.

Credit

NASA Climate Change website

Preview

Embed

Embed this resource by pasting the following code into your website:

<iframe src="https://climate.nasa.gov/quizzes/home-planet-quiz/" width="916" height="620"></iframe>

More Like This

  • Atmosphere
  • Carbon cycle
  • Global warming
  • Land change
  • Oceans and ice
  • Water cycle

Related

Salinity plays a major role in global ocean circulation and changes in salinity may impact regional and global climates. NASA's Aquarius mission is painting a global picture of our planet's salty waters.
More
Salinity plays a major role...
Video: Aquarius
Video: Using observations from NASA's Orbiting Carbon Observatory (OCO-2) satellite, scientists developed a model of the behavior of carbon in the atmosphere from September 1, 2014 to August 31, 2015.
More
Following carbon dioxide th...
Video: Following atmospheric carbon dioxide
This visualization shows carbon emissions from fires from January 1, 2003 through December 31, 2018. The color bar reflects the quantity of carbon emitted.
More
Carbon Emissions from Fires...
Carbon Emissions from Fires: 2003-2018
The visualization shows monthly global temperature anomalies (changes from an average) between the years 1880 and 2022.
More
Video: Climate Spiral (1880...
Video: Climate Spiral (1880-2022)
Video: how different factors, both natural and industrial, contribute to global warming.
More
How global warming stacks up
Video: How global warming stacks up
This animation compares sea surface salinity (saltiness) data from two NASA datasets from 2015 to 2017.
More
Animation: Sea Surface Sali...
Animation: Sea Surface Salinity (Saltiness) Comparison (2015-2017)
Video: Simulation of global clouds and aerosols from September 1, 2005, to December 31, 2005.
More
Video: Simulated clouds and...
Video: Simulated clouds and aerosols
Animation showing changes in Greenland ice mass since 2002 based on satellite data.
More
Video: Greenland Ice Mass L...
Video: Greenland Ice Mass Loss 2002-2023
La NASA no estudia solo las estrellas y los planetas; también le preocupa la tierra debajo de tus pies.
More
La humedad de la Tierra
This animation shows how global sea levels have risen more than 80 millimeters (3.15 inches) over the past three decades, which is like covering the U.S. in about 4 meters (about 13 feet) of water over that period.
More
Animation: Global Sea Level...
Animation: Global Sea Level Change (1992-2017)
Graphic: A simplified animation of the greenhouse effect.
More
The Greenhouse Effect
Graphic: The Greenhouse Effect
NASA scientists say 2013 tied for the seventh warmest of any year since 1880, continuing a long-term trend of rising global temperatures.
More
Video: Global Temperature V...
Video: Global Temperature Variation
Aprende cómo se desplaza el dióxido de carbono alrededor de la Tierra. Además, el archivo descargable incluye una página con definiciones de términos.
More
EL CICLO DEL DIÓXIDO DE CAR...
Página de colorear: El ciclo del dióxido de carbono
A graphic briefly explains the relationship between volcanoes and climate change.
More
Graphic: Volcanoes and Clim...
Graphic: Volcanoes and Climate Change
Sentinel-6 Michael Freilich will join a long-standing family of Earth-observing satellites from NASA and European partners, including EUMETSAT and the French space agency CNES.
More
Video: Sentinel-6 Michael F...
Video: Sentinel-6 Michael Freilich Satellite Family Tree
Head into the field with first responders, fire scientists and forest managers to see what challenges they face and how NASA can help mitigate the effects of longer and more intense fire seasons.
More
Operation Earth: Wildfires
Video: 'Operation Earth: Wildfires'
The relentless rise of carbon dioxide levels in the atmosphere.
More
The inexorable rise of carb...
Graphic: The relentless rise of carbon dioxide
A visualization shows global temperature changes per latitude zone from 1880 to 2022.
More
Video: Global Warming Broke...
Video: Global Warming Broken Down by Latitude Zone (1880-2022)
This visualization depicts changes in Greenland land ice thickness as measured by the ICESat and ICESat-2 satellites.
More
Greenland Land Ice Height C...
Greenland Land Ice Height Change as Measured by ICESat and ICESat-2
Continuing key Earth observations is really important to see how our atmosphere, land, and ocean are changing over time. A long-term record, combined with cutting-edge observations from the new NASA Earth System Observatory, will continue to push boundaries to better understand our ever-changing planet.
More
How NASA Satellites Help Mo...
How NASA Satellites Help Model the Future of Climate
Video: Explore how scientists determine glacial speed from space.
More
At glacial speed
Video: At glacial speed
A graphic shows that when fossil fuel-derived greenhouse gas emissions stop, global warming stops within a few years.
More
Graphic: When Emissions Sto...
Graphic: When Emissions Stop, Warming Stops
The past decade has been the hottest ever recorded since global temperature records began 150 years ago. This video discusses the impacts of the sun's energy, Earth's reflectance and greenhouse gasses on global warming.
More
The past decade has been th...
Video: Temperature Puzzle
Video: The ocean's important role in absorbing heat and carbon dioxide from the atmosphere.
More
Ocean circulation plays an ...
Video: Ocean circulation plays an important role in absorbing carbon from the atmosphere
Pliocene CO2 graphic - climate.nasa.gov
More
Pliocene CO2 graphic - clim...
Graphic: Carbon dioxide hits new high
more resources

Explore

Interactives, galleries and apps

Images of Change

Images of Change

Explore a stunning gallery of before-and-after images of Earth from land and space that reveal our home planet in a state of flux.
More
Climate Time Machine

Climate Time Machine

Travel through Earth's recent climate history and see how increasing carbon dioxide, global temperature and sea ice have changed over time.
More
Eyes on the Earth

Eyes on the Earth

Track Earth's vital signs from space and fly along with NASA's Earth-observing satellites in an interactive 3D visualization.
More
Global Ice Viewer

Global Ice Viewer

Earth's ice cover is shrinking. See how climate change has affected glaciers, sea ice, and continental ice sheets.
More
more multimedia

Get the Newsletter

Stay Connected

Facts

    • Evidence
    • Causes
    • Effects
    • Scientific Consensus
    • What Is Climate Change?
    • Vital Signs
    • Extreme Weather
    • Questions (FAQ)

News

    • News and Features
    • Subscribe
    • Climate Newsletter Archive

Solutions

    • Earth Science in Action
    • Mitigation and Adaptation
    • Sustainability and Government Resources

Explore

    • Images of Change
    • Earth Minute Videos
    • Interactives
    • Beautiful Earth Gallery
    • Ask NASA Climate

NASA Science

    • Science Mission Directorate
    • NASA Data Resources
    • Earth System Science
    • Earth Science Missions
    • History
    • People

More

    • For Media
    • For Educators
    • Multimedia
    • En español
    • For Kids
    • About Us
  • Feedback
  • |
  • Awards
  • |
  • Sitemap
  • |
  • Earth Observatory
  • |
  • SEA LEVEL CHANGE
  • |
  • Privacy
  • |
  • Climate Data Initiative
  • |
  • U.S. CLIMATE RESILIENCE TOOLKIT

This website is produced by the Earth Science Communications Team at

NASA's Jet Propulsion Laboratory | California Institute of Technology

Site Owner: Anya Biferno
Site Editor: Holly Shaftel
Managing Editor: Susan Callery
Senior Producer: Randal Jackson
Senior Science Editor: Daniel Bailey
Science Editor: Susan Callery

Site last updated: September 21, 2023