News | June 19, 2013
Vegetation as seen by Suomi NPP
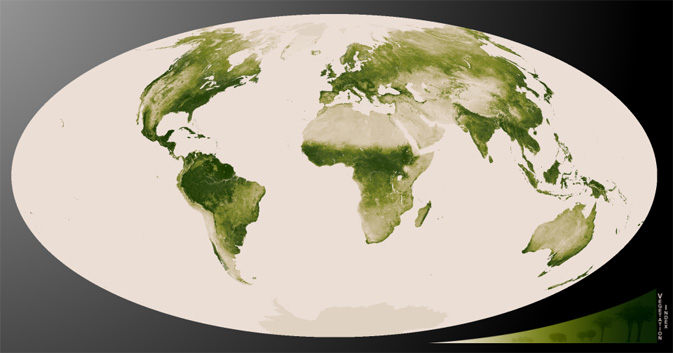
World map of vegetation created with Suomi NPP data. Credit: NASA/NOAA View NOAA animation
By Audrey Haar,
NASA's Earth Science News Team
Images crafted from a year’s worth of data collected by the Suomi NPP satellite provide a vivid depiction of worldwide vegetation. Suomi NPP, short for National Polar-orbiting Partnership, is a partnership between NASA and the National Oceanic and Atmospheric Administration.
The images show the difference between green and arid areas of Earth as seen in data from the Visible-Infrared Imager/Radiometer Suite, or VIIRS, instrument aboard Suomi NPP. VIIRS detects changes in the reflection of light, producing images that measure vegetation changes over time.
The Suomi NPP vegetation data will be incorporated into many Normalized Difference Vegetation Index, or NDVI-based products and services, including environmental monitoring, numerical weather prediction models and the U.S. Drought Monitor operated by the National Drought Mitigation Center.
This vegetation index measures and monitors plant growth, vegetation cover and biomass production from satellite information. It is calculated from the visible and near-infrared light reflected by vegetation.
NDVI represents the photosynthetic potential of vegetation. The summation or integration of NDVI over time represents gross primary production. High index values represent dense, green, functioning vegetation. Low values represent sparse vegetation or vegetation under stress from conditions, such as drought.
The measurements from VIIRS continue some of the data records collected by several NASA satellites, including Terra and Aqua, in orbit since December 1999 and February 2002, respectively. Terra and Aqua each make use of an instrument called the Moderate-resolution Imaging Spectroradiometer, or MODIS, which looks at global vegetation along with other Earth features.


