News | June 17, 2013
Water storage maps show improvement
Maps by Chris Poulsen, National Drought Mitigation Center at the University of Nebraska-Lincoln, based on data from Matt Rodell, NASA Goddard Space Flight Center, and the GRACE science team. Caption by Mike Carlowicz, with assistance from Matt Rodell and Chris Poulsen. Download web resolution animation (18 MB, QuickTime); download high definition animation (101 MB, QuickTime).
In 2012, the continental United States suffered through one of its worst droughts in decades. Nearly 80 percent of the nation’s farm, orchard, and grazing land was affected in some way, and 28 percent experienced extreme to exceptional drought. As another summer arrives in North America, surface water conditions have improved in many places, but drought has persisted or deepened in others. Underground, the path out of drought is much slower.
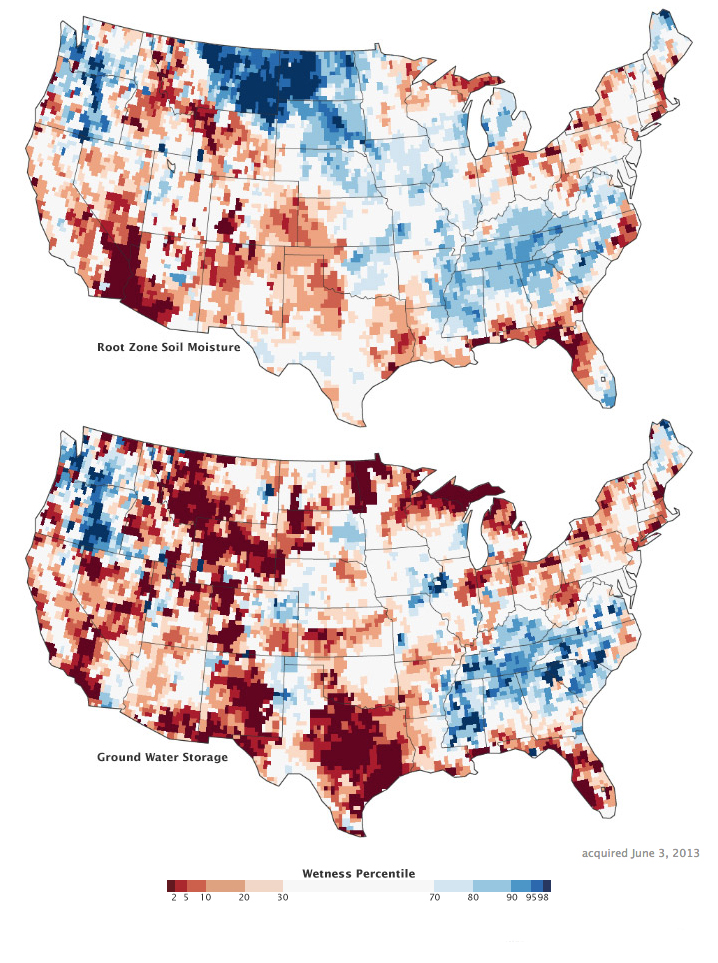
The maps above combine data from the Gravity Recovery and Climate Experiment (GRACE) with other satellite and ground-based measurements to model the amount of water stored near the surface and underground as of June 3, 2013. The maps are experimental products funded by NASA’s Applied Sciences Program and developed by scientists at NASA’s Goddard Space Flight Center and the National Drought Mitigation Center. They represent changes in water storage related to weather, climate, and seasonal patterns.
The first map shows the “wetness” or moisture content in the “root zone”—the top meter (39 inches) of soil. The second map shows water storage in shallow aquifers. The current water content is compared to a long-term average for early June between 1948 and 2009. The darkest red regions represent dry conditions that should occur only 2 percent of the time (about once every 50 years). To see the monthly changes from August 2002 through May 2013, download the animation below the second image.
The root zone map offers perspective on the short-term (weeks to months) water situation; for instance, the passage of a tropical storm can have a distinct impact on root zone moisture. Compared to the summer of 2012, moisture near the surface in June 2013 is significantly better in most of the eastern and northern portions of the continental United States, particularly the Midwestern areas around the Mississippi River. Flooding has instead become the problem in Montana and North Dakota. Portions of Arizona, Nevada, and southeastern California are extremely dry, even by desert standards.
The second map tells more of a long-range story. Groundwater takes months to seep down and recharge aquifers, and that clearly has not happened in the Rocky Mountain states and most of Texas. Underground storage has improved in much of the southeastern and central U.S., though not in Florida. Southern California has a deficit despite promising signs in the winter and spring. Click here to see what water storage looked like as of January 2013.
Read more about GRACE and studies of groundwater in our feature: The Gravity of Water.
Further Reading
- NASA Earth Observatory (2013, January 19) Despite Rain, Drought Lingers in the United States.
- NASA Earth Observatory (2012, September 20) Signs of the US Drought are Underground.
- NASA Earth Observatory (2011, December 1) Texas Groundwater Severely Depleted.
- U.S. Department of Agriculture, Economic Research Service (2013, June 13) U.S. Drought 2012: Farm and Food Impacts. Accessed June 17, 2013.
- U.S. Drought Portal (2013, May 13) Summer 2013 National Drought Outlook. Accessed June 17, 2013.