News | September 27, 2023
NASA-Led Study Pinpoints Areas of New York City Sinking, Rising

The land beneath the New York City area, including the borough of Queens, pictured here, is moving by fractions of inches each year. The motions are a legacy of the ice age and also due to human land usage. Credit: NASA/JPL-Caltech
Parts of the New York City metropolitan area are sinking and rising at different rates due to factors ranging from land-use practices to long-lost glaciers, scientists have found. While the elevation changes seem small – fractions of inches per year – they can enhance or diminish local flood risk linked to sea level rise.
The new study was published Wednesday in Science Advances by a team of researchers from NASA’s Jet Propulsion Laboratory in Southern California and Rutgers University in New Jersey. The team analyzed upward and downward vertical land motion – also known as uplift and subsidence – across the metropolitan area from 2016 to 2023 using a remote sensing technique called interferometric synthetic aperture radar (InSAR). The technique combines two or more 3D observations of the same region to reveal surface motion or topography.
Much of the motion they observed occurred in areas where prior modifications to Earth’s surface – such as land reclamation and the construction of landfills – made the ground looser and more compressible beneath subsequent buildings.
Some of the motion is also caused by natural processes dating back thousands of years to the most recent ice age. About 24,000 years ago, a huge ice sheet spread across most of New England, and a wall of ice more than a mile high covered what is today Albany in upstate New York. Earth’s mantle, somewhat like a flexed mattress, has been slowly readjusting ever since. New York City, which sits on land that was raised just outside the edge of the ice sheet, is now sinking back down.
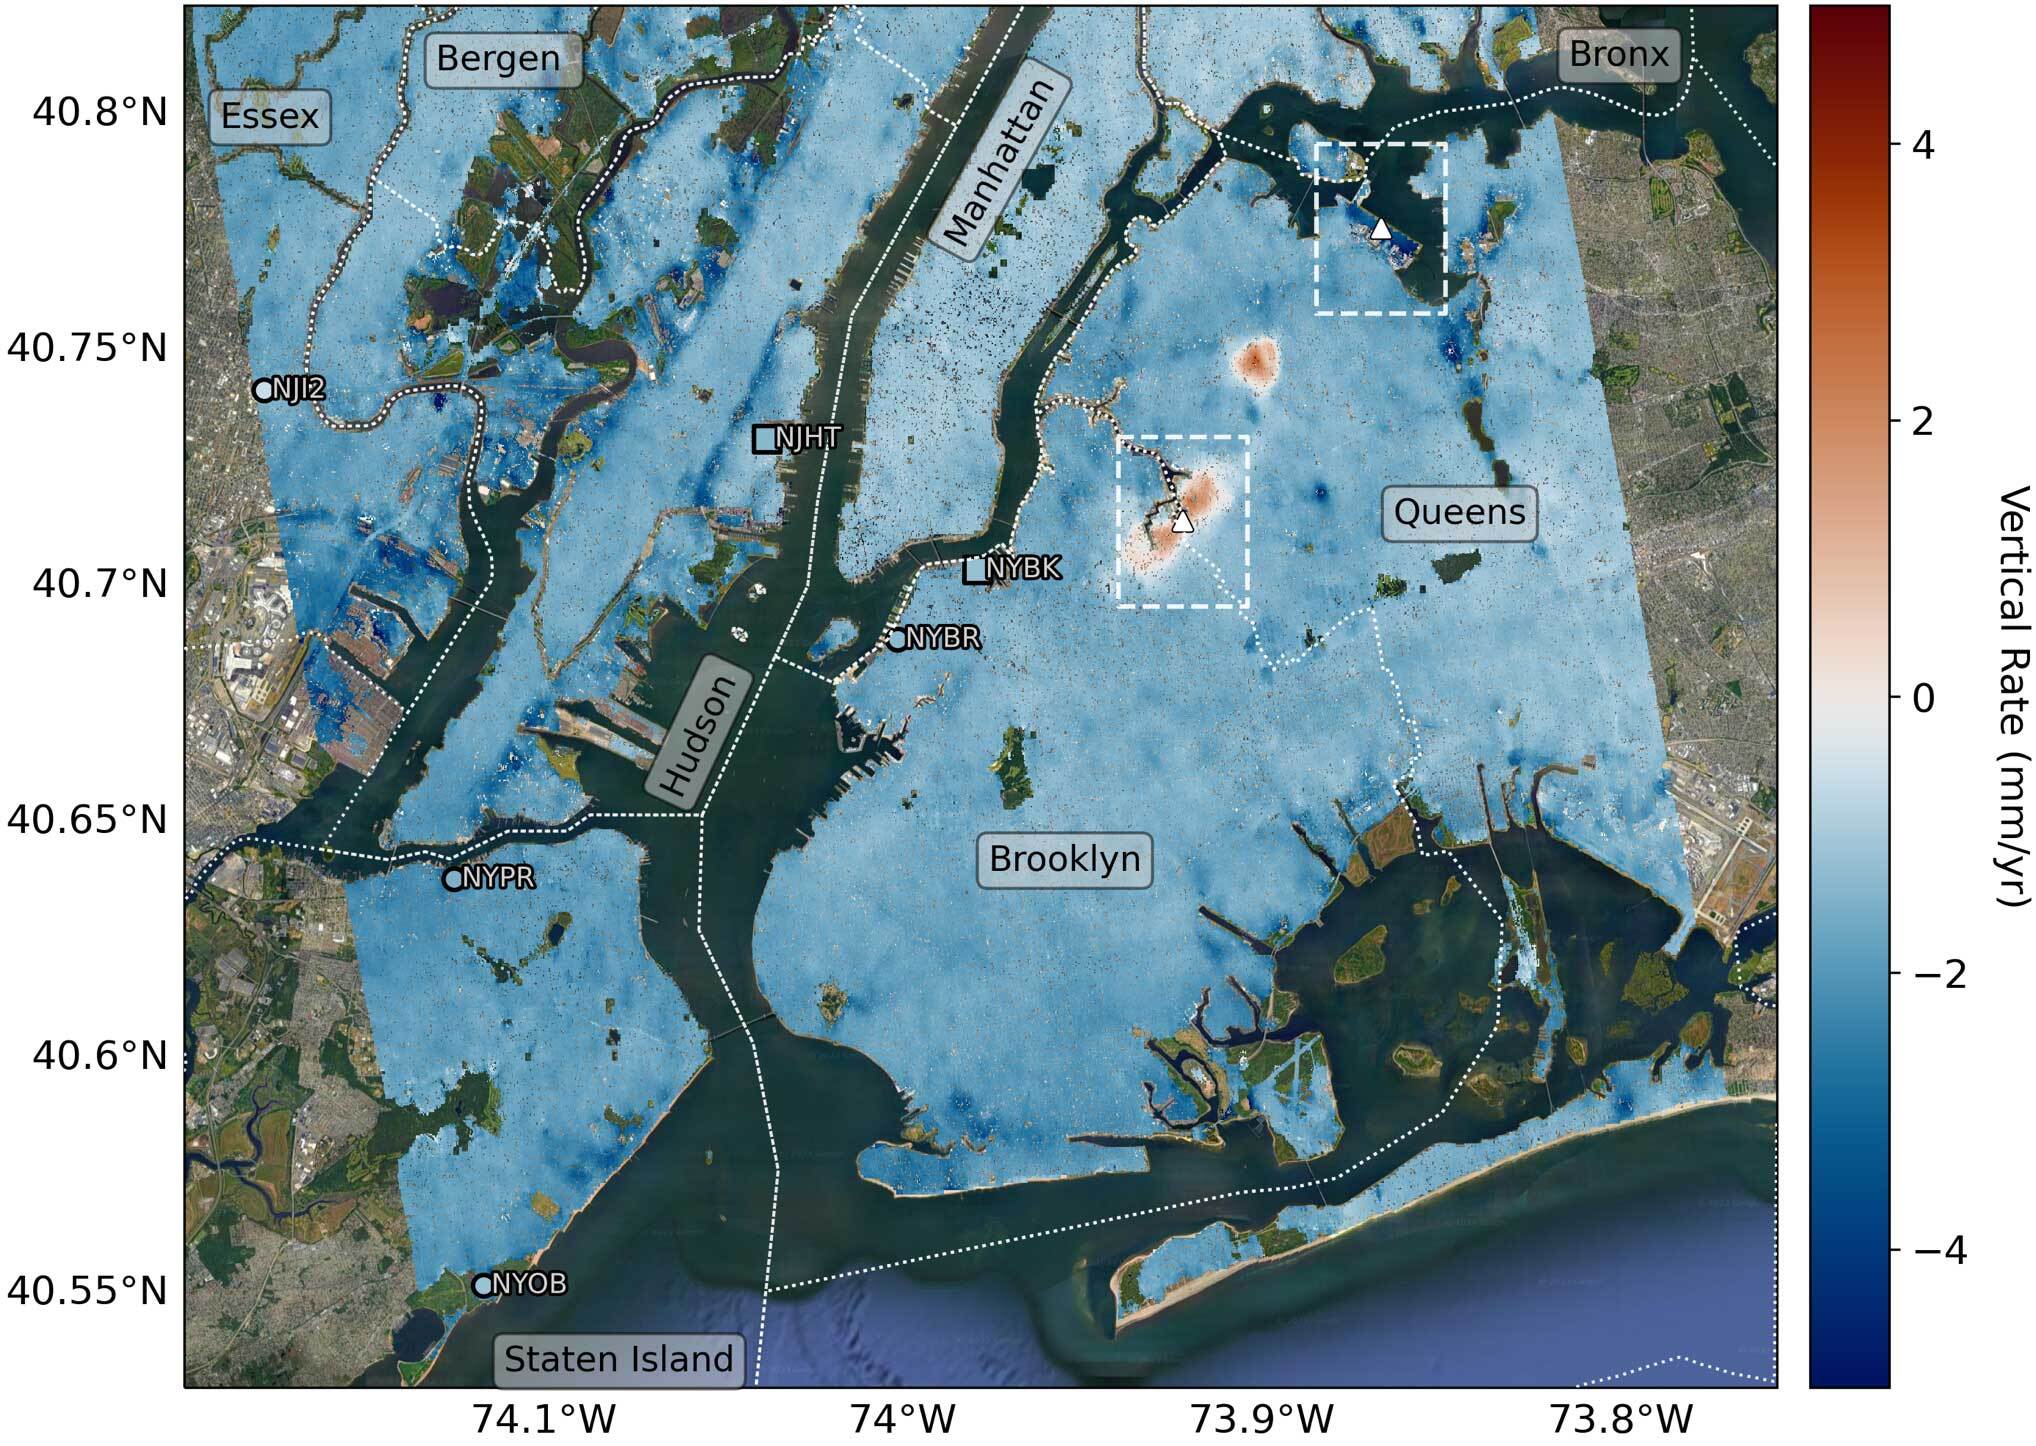
The scientists found that on average the metropolitan area subsided by about 0.06 inches (1.6 millimeters) per year – about the same amount that a toenail grows in a month. Using the radars on the ESA (European Space Agency) Sentinel-1 satellites, along with advanced data processing techniques, they mapped the motion in detail and pinpointed neighborhoods and landmarks – down to an airport runway and tennis stadium – that are subsiding more rapidly than the average.
“We’ve produced such a detailed map of vertical land motion in the New York City area that there are features popping out that haven’t been noticed before,” said lead author Brett Buzzanga, a postdoctoral researcher at JPL.
David Bekaert, a JPL scientist and lead investigator of the project, said that tracking local elevation changes and relative sea level can be important for flood mapping and planning purposes. This is especially critical as Earth’s changing climate pushes oceans higher around the world, leading to more frequent nuisance flood events and exacerbating destructive storm surges.
Local Changes
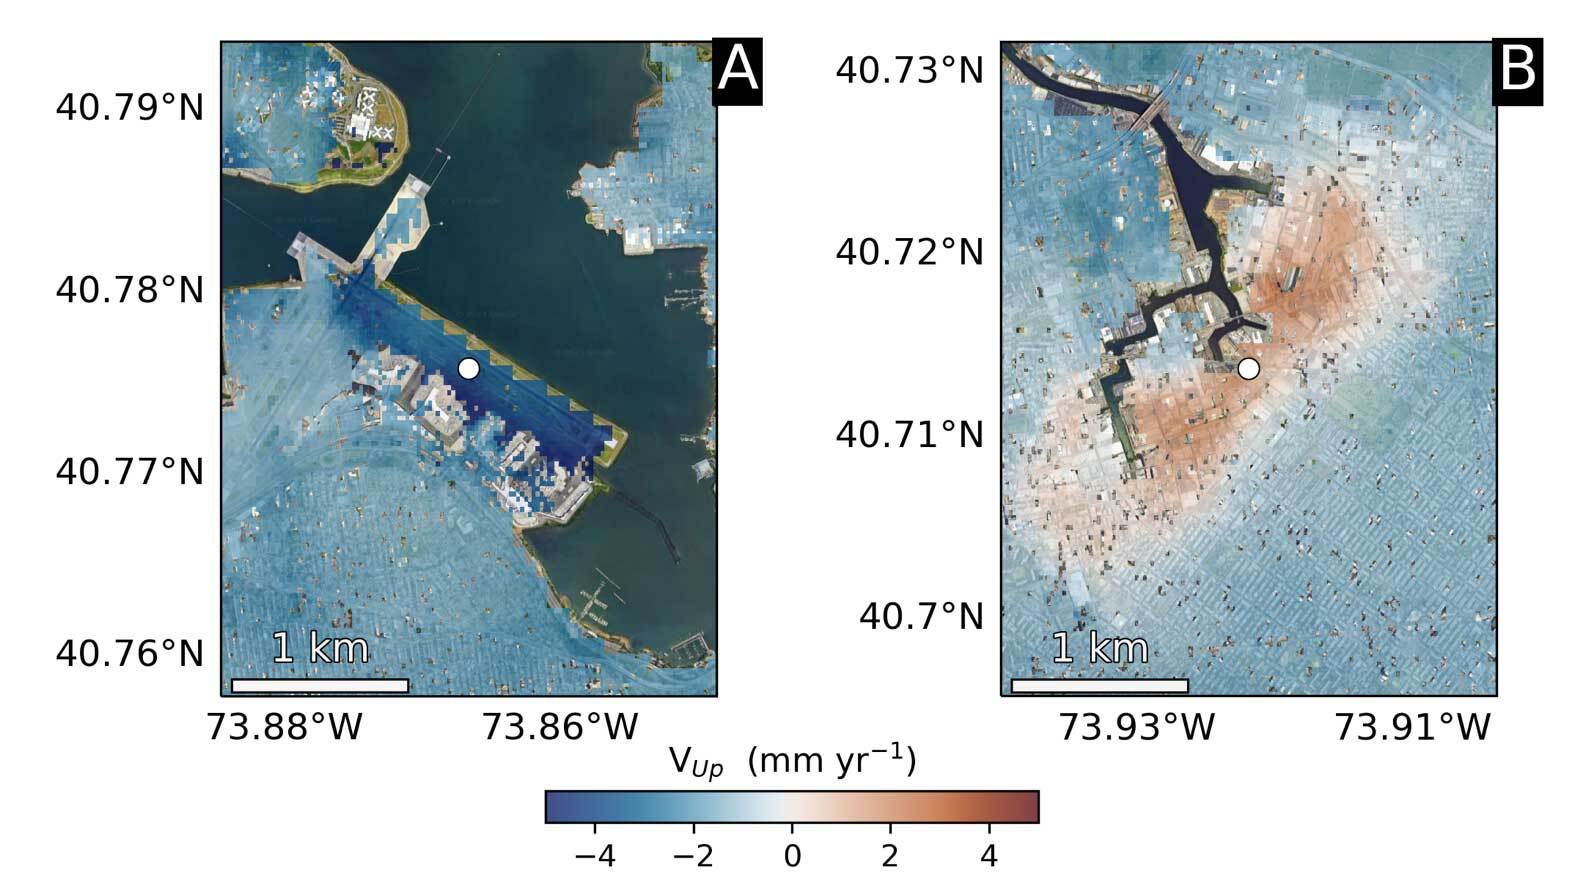
The team identified two notable hot spots of subsidence co-located with landfills in Queens. One, runway 13/31 at LaGuardia Airport, is subsiding at a rate of about 0.15 inches (3.7 millimeters) per year. The scientists noted that the airport is undergoing an $8 billion renovation designed in part to alleviate flooding from the rising waters of the Atlantic Ocean. They also identified Arthur Ashe Stadium, which is sinking at a rate of about 0.18 inches (4.6 millimeters) per year and required construction of a lightweight roof during renovation to reduce its heaviness and amount of subsidence.
Other subsidence hot spots include the southern portion of Governors Island – built on 38 million square feet (3.5 million cubic meters) of rocks and dirt from early 20th century subway excavations – as well as sites near the ocean in Brooklyn’s Coney Island and Arverne by the Sea in Queens that were built on artificial fill. Similar levels of subsidence were observed beneath Route 440 and Interstate 78 in suburban New Jersey, which traverse historic fill locations, and in Rikers Island, expanded to its present size by landfilling.
The scientists also found previously unidentified uplift in East Williamsburg, Brooklyn – rising by about 0.06 inches (1.6 millimeters) per year – and in Woodside, Queens, which rose 0.27 inches (6.9 millimeters) per year between 2016 and 2019 before stabilizing. Co-author Robert Kopp of Rutgers University said that groundwater pumping and injection wells used to treat polluted water may have played a role, but further investigation is needed. “I’m intrigued by the potential of using high-resolution InSAR to measure these kinds of relatively short-lived environmental modifications associated with uplift,” Kopp said.
The scientists said that cities like New York, which are investing in coastal defenses and infrastructure in the face of sea level rise, can benefit from high-resolution estimates of land motion.
The JPL-led OPERA (Observational Products for End-Users from Remote Sensing Analysis) project will detail surface displacement across North America in a future data product. To do that, it will leverage InSAR data from ESA’s Sentinel-1 and from the upcoming NISAR (NASA-Indian Space Research Organization Synthetic Aperture Radar) mission, set to launch in 2024. Information from OPERA will help scientists better monitor vertical land motion along with other changes connected to natural hazards.
News Media Contacts
Jane J. Lee / Andrew Wang
Jet Propulsion Laboratory, Pasadena, Calif.
818-354-0307 / 626-379-6874
jane.j.lee@jpl.nasa.gov / andrew.wang@jpl.nasa.gov


