News | November 12, 2014
Four decades of sea ice from space: The future
Scientists have used satellites to observe the retreat of Arctic sea ice from above. But the bigger challenge – now and in the coming years – is understanding what is happening below. This animation compares the difference in the area, volume and depth of the average September Arctic sea ice between 1979, shown in blue, and 2013, shown in orange. This data comes from the Pan-Arctic Ice Ocean Modeling and Assimilation System (PIOMAS). Credit: NASA's Scientific Visualization Studio
While the world has watched the extent of the Arctic Ocean’s icy cap shrink in recent years, the ice has also been attacked from beneath, making the ice cover thinner, weaker and more vulnerable. In the summer of 2012 when Arctic sea ice dipped to a new record low extent, the thinning of the ice was just as dramatic. At the peak of summer melt in 2012 – according to a University of Washington computer model – the total Arctic sea ice volume was only one-third of what it was in 1979.
And yet, scientists still don’t have as much information as they need about the changing thickness of the ice cover in order to truly understand how Arctic sea ice is responding to changing climate.
“Since I started in this field, thickness has been the holy grail of understanding sea ice changes,” said Thorsten Markus, chief of the Cryospheric Sciences Laboratory at NASA Goddard Space Flight Center in Greenbelt, Maryland.
The retreat of Arctic sea ice could have significant implications for ocean circulation, atmospheric circulation and even weather patterns in the continental U.S. and other populated areas. If scientists are going to be able to better understand and predict how the Arctic sea ice cover will continue to respond to climate change, they need better measurements of sea ice thickness.
“We have a good handle on the extent,” Markus said. “But in order to get the sea ice mass, we need to know the thickness as well.”
Thickness matters
Ice thickness is the most important indicator of Arctic sea ice’s ability to survive a summer melt season. But it is difficult – logistically and physically – to measure. Some measurements come from satellites, others from submarines and field campaigns. But unlike for sea ice extent and many other key climate change benchmarks, there are no continuous measurements across time and space.
The first comprehensive thickness study came from a team led by University of Washington, Seattle researcher Drew Rothrock, who in 1999 compared recently declassified data that military submarines had collected in the central Arctic from the 1950s to the 1970s to measurements taken by submarine cruises in the 1990s.
Rothrock found that sea ice in the central Arctic in the 1990s was almost 60 percent thinner than the sea ice found in that area in previous decades – but sea ice doesn’t stay in place, and since Rothrock didn’t have data on how sea ice might have moved around during that period, it was difficult to tell whether the submarines had been measuring the same ice or not.
“The sampling was done mostly in the middle of the Arctic, so there was a question as to whether the thicker ice had moved elsewhere,” said Ron Kwok, a senior research Scientist at NASA’s Jet Propulsion Laboratory in Pasadena, California who worked with Rothrock in subsequent ice thickness studies. “We needed a better picture, a map rather than samples across the Arctic.”
In the following years, there were several approaches to mapping the thickness of Arctic sea ice using satellites, starting with the use of radar altimetry from the European Space Agency’s European Remote Sensing satellites.
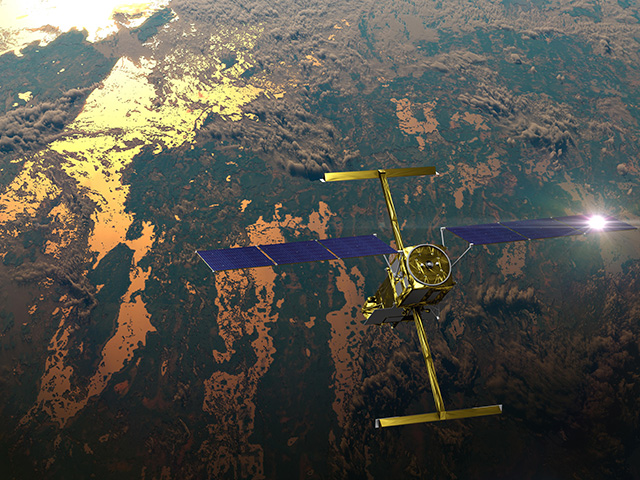
In 2003, NASA launched the Ice, Cloud, and land Elevation Satellite (ICESat), a spacecraft carrying a laser altimeter that provided elevation data of the sea ice cover. These laser measurements – during the satellite’s life from 2003-2009 – allowed scientists to estimate thickness of the sea ice across the Arctic and Antarctic by measuring what’s called “freeboard” – the fraction of an ice floe above the water surface. With this measurement, scientists can calculate thickness and volume.
“With thickness, we’re trying to measure something that we can’t see directly – if you’re flying on an airplane, you can’t look down and say the ice is this much thick,” said Walt Meier, a sea ice scientist at NASA Goddard. “It’s the same with satellites – they’re not directly measuring thickness, they’re measuring the freeboard, which is above the sea surface.”
Foreseeing the future
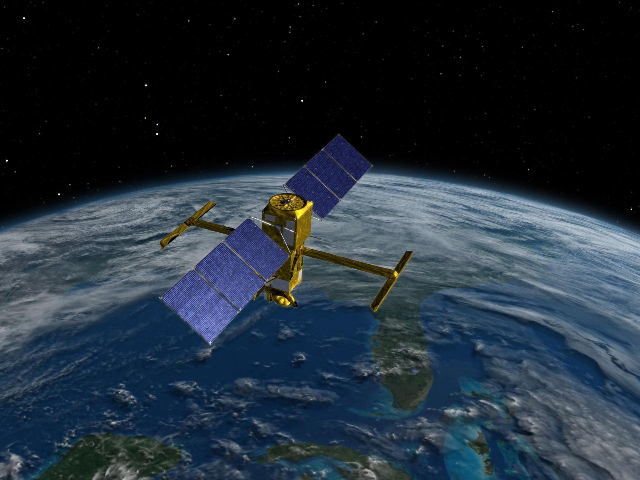
The lack of accurate sea ice thickness measurements, though they are improving, means researchers cannot reliably predict the severity of an upcoming melt season. This is because scientists don’t have enough accurate data to feed into computer models that could help make this prediction. Current measurements from NASA’s Operation IceBridge airborne campaign and the European satellite Cryosat-2 are allowing scientists to make some thickness estimates. ICESat-2 will launch in several years, adding another spaceborne asset to the mix.
Meanwhile, the Arctic sea ice minimum will continue to grow and shrink from year to year – but there seems to be no reason the summer ice extent will not continue to shrink in the long term. Any number of factors can influence the size of a certain year’s minimum: the depth of snow on top of the ice, melt ponds on the surface, weather patterns and storms.
But, once again, answering the big, long-term questions such as when the Arctic might be “ice free” in summer will require better measurements and understanding of sea ice thickness.
“From the submarine data we know that the ice is thinner and thinner,” said Nathan Kurtz, a sea ice scientist at NASA Goddard. “Once it reaches a certain point, it’s not going to survive the summer.”


