Ask NASA Climate | August 2, 2016, 11:27 PDT
Greenland on the edge
Where ice meets water at the bottom of the sea
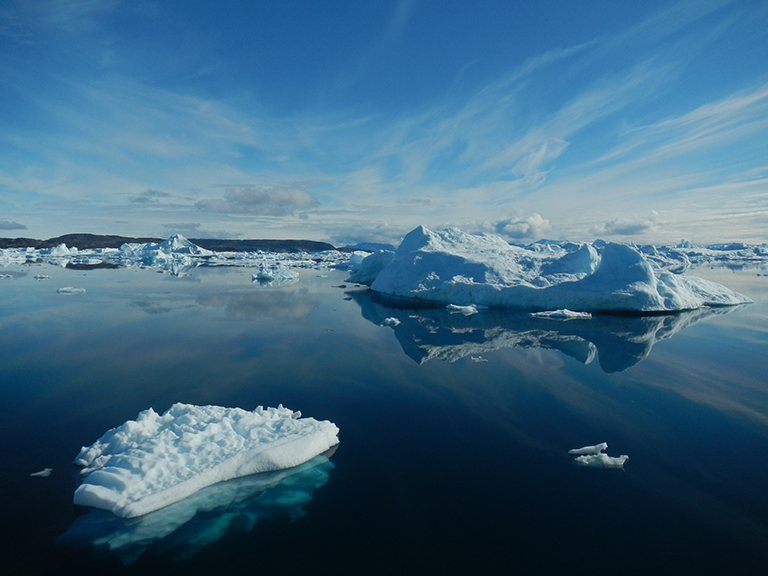
Greenland's southwestern coastline in July and August 2015 during Phase 1 of the Oceans Melting Greenland (OMG) mission's TerraSond / Cape Race Bathymetry survey. Credit: NASA/JPL.
A person can look at a thing over and over again before finally seeing it for the first time. That’s how I felt standing in front of an Arctic map at the University of Washington in Seattle. I gazed at the northwest coastline of Greenland, north of Baffin Bay, up where the Canadian Queen Elizabeth Islands come close to Greenland.
Of course I’ve looked at Arctic maps before, from a zillion different angles. Normally I’m the one pointing and explaining. “Look at how small the Arctic area is. It’s a shallow sea, mostly surrounded by continents and islands where sea ice forms and gets trapped,” I say, encouraging folks to get as excited as I am about this remote part of the planet that’s chopped up, spread out and distorted by most maps. But this time, standing next to James Morison, senior principal oceanographer from the University of Washington, I was the one listening, looking closely and being amazed.
A person can look at a thing over and over again before finally seeing it for the first time.
We were in the hallway of the Applied Physics Laboratory’s polar science wing, taking a break between Oceans Melting Greenland (OMG) science team presentations. The walls were lined with photos of teams out on glaciers, ice drilling equipment, ice sheets of the world and grand ice-covered landscapes. Ice, ice and more ice, and penguins. There were pictures of polar bears and narwhals, too. But Greenland’s jagged coastline had me captivated. The islands, the convolutions, the fjords: phenomenal, mindboggling. I couldn’t take my mind off it.

But the Oceans Melting Greenland team is doing more than looking at maps of Greenland. Way more. “We’re trying to look under the ice,” Principal Investigator Josh Willis told me. “What is the sea floor like under there? What is the interface between where the bottom of the ice sheet reaches out over the seawater and down into the ocean?”
The seawater around 400 meters (1,312 feet) deep is 3 to 4 degrees Celsius (5 to 8 degrees Fahrenheit) warmer than the water floating near the sea surface. And the shape of the sea floor (bathymetry) influences how much of that warm, subsurface layer can reach far up into the fjords and melt the glaciers. The OMG team wants to measure how much of that warm water could be increasing due to climate change.
What will the future hold? Will we see 5 feet of sea level rise … or 10 or 20?
And even though Greenland feels untouched and remote, feels so “Who cares?” we all need to be concerned about its complex coastline and the rapid pace of its melting ice sheet. NASA’s GRACE satellites observed Greenland shedding a couple trillion—with a “t”—tons of ice over the last decade, and the rate of melt is increasing. So that winding coastline and those unfamiliar fjords have already impacted all of us—yes, that means you—undoubtedly, no matter how far away or how far inland you reside.
As each of the dozen or so OMG members took his or her turn updating the team on their most recent topography, temperature and salinity measurements, I noticed a trend. Everyone kept repeating the phrases “never been surveyed before,” “it’s a very tough area,” and “these fjords are so very small, they have no names and have never been visited before.” They are literally exploring these unknown areas in detail for the first time.
My mind drifted off to the edge of that unimaginably complicated winding coastline, that unknown place where ice meets water meets seafloor, where the ice is melting as fast as we can measure. And I had to stop the group to ask why. Specifically, why is it so tough? Why has no one been there before? It turns out this area is difficult to navigate because big chunks of remnant sea ice clog up the water. The crew has to snake in between floating icebergs and weave in and out of the narrow fjords. It’s rather treacherous. And weather conditions can be challenging up there. The other reason this area is so unknown is that the glacier has retreated so recently that the coastline is changing as fast or even faster than we can study it.
Last summer, a small group that included UC Irvine graduate student Michael Wood sailed on the M/V Cape Race deep into some of the most jagged areas around southeastern Greenland, which, according to Co-Investigator Eric Rignot, is the “most complex glacier setting in Greenland.” After more than 7,871 kilometers (4,250 nautical miles) and more than 300 Conductivity, Temperature Depth (CTD) casts, the first bathymetric survey was completed.NASA’s GRACE satellites observed Greenland shedding a couple trillion—with a “t”—tons of ice over the last decade, and the rate of melt is increasing.
Over the next five years, OMG will measure the volume of warmer water on the continental shelf around Greenland to figure out whether there is more warm water entering the fjords and increasing ice loss at the glacier terminus.

Here are some details about the OMG plan:
- Every year for four years, survey glacier elevation near the end of marine-terminating glaciers around Greenland’s coastline using NASA’s airborne synthetic aperture radar altimeter GLacier and Ice Surface Topography INterferometer (GLISTIN-A).
- Every year for five years, deploy 250 Aircraft eXpendable Conductivity Temperature Depth (AXCTD) probes to measure temperature and salinity of the waters around Greenland from one of NASA’s G-III aircraft.
- Use a ship with multi-beam sonar to measure bathymetry of the seafloor up very close to the extremely jagged coastline of Greenland, as well as a small vessel with a single beam going up into small places, driving up fjords and getting as close to glaciers as is safe.
- Collect gravity measurements from small planes in Northwest, Southeast and Northeast Greenland to help map the sea floor in places the ships cannot go.
Find out more about Oceans Melting Greenland.
View and download OMG animations and graphics.
Thank you for your comments.
Laura
Oceans Melting Greenland is part of NASA Earth Expeditions, a six-month field research campaign to study regions of critical change around the world.