Global Temperature
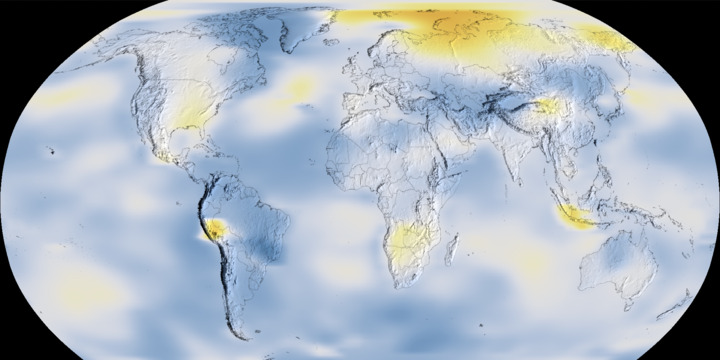
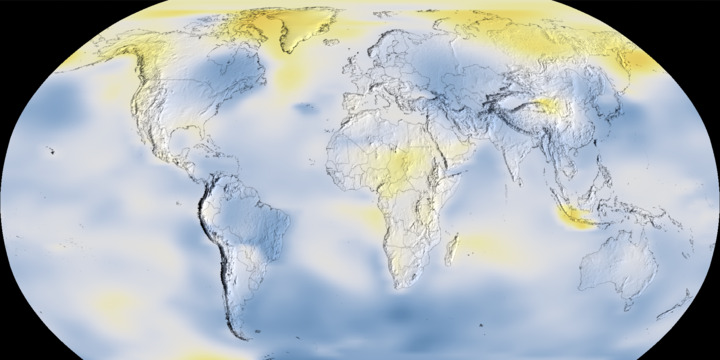
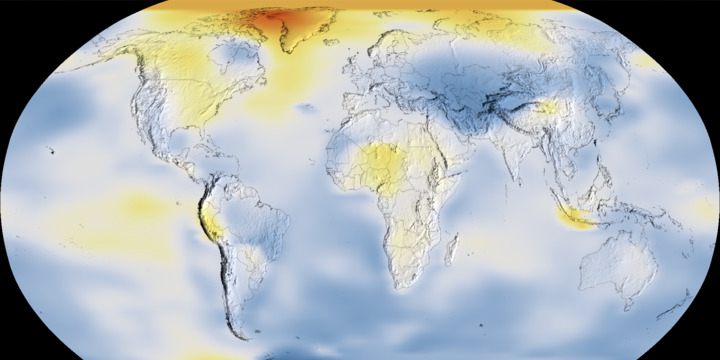
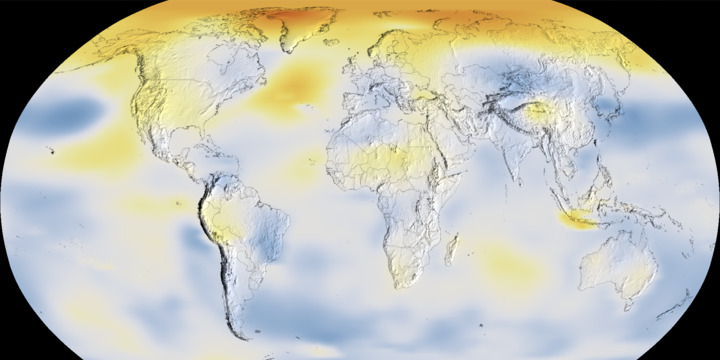
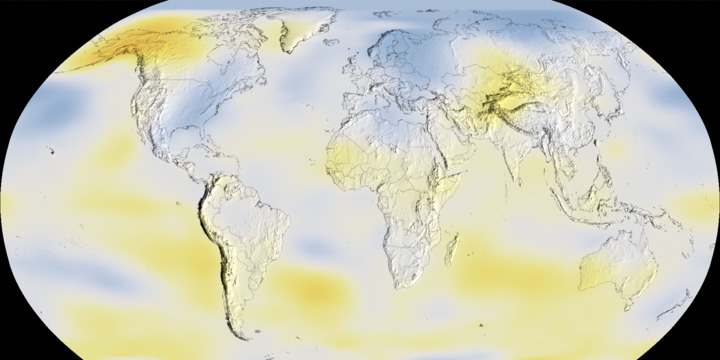
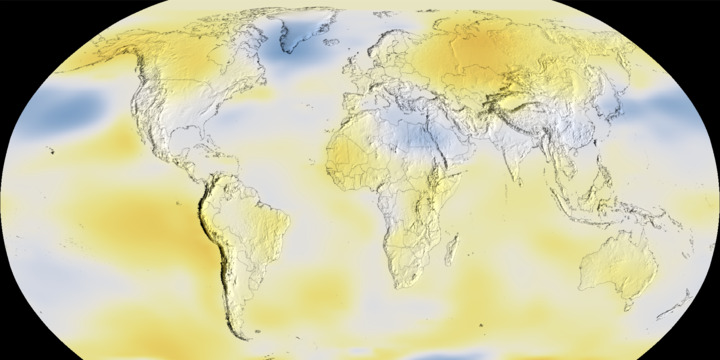
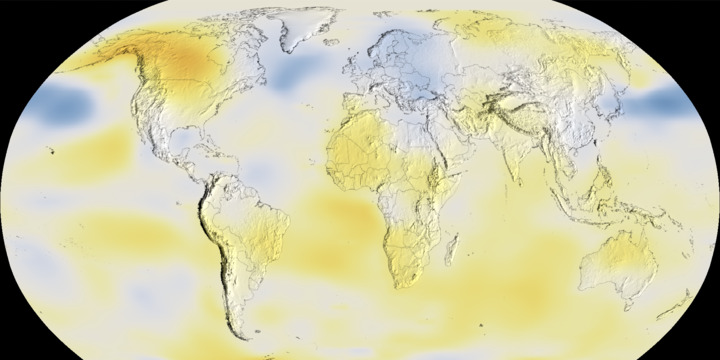
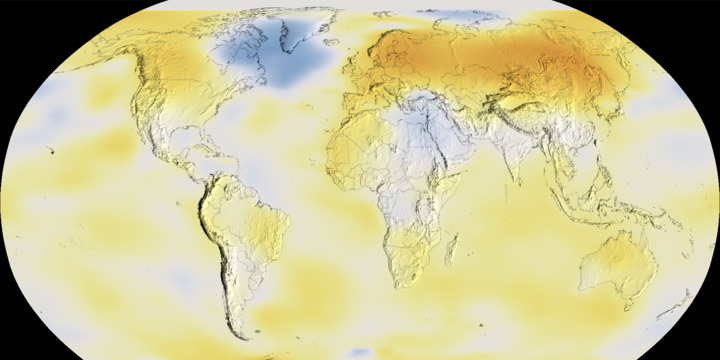
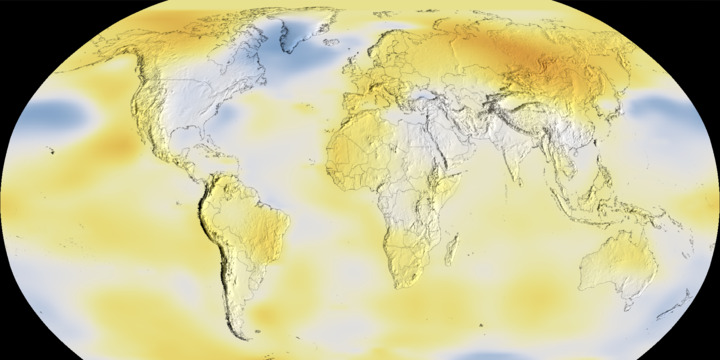
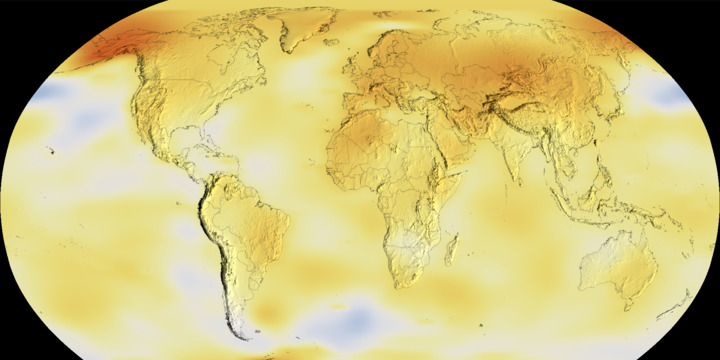
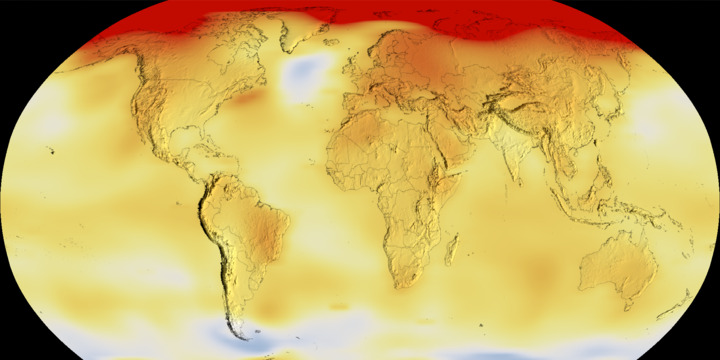
This graph shows the change in global surface temperature compared to the long-term average from 1951 to 1980. Earth’s average surface temperature in 2024 was the warmest on record since recordkeeping began in 1880 (source: NASA/GISS). NASA’s analysis generally matches independent analyses prepared by the National Oceanic and Atmospheric Administration (NOAA) and other research groups. Overall, Earth was about 2.65 degrees Fahrenheit (or about 1.47 degrees Celsius) warmer in 2024 than in the late 19th-century (1850-1900) preindustrial average. The 10 most recent years are the warmest on record.
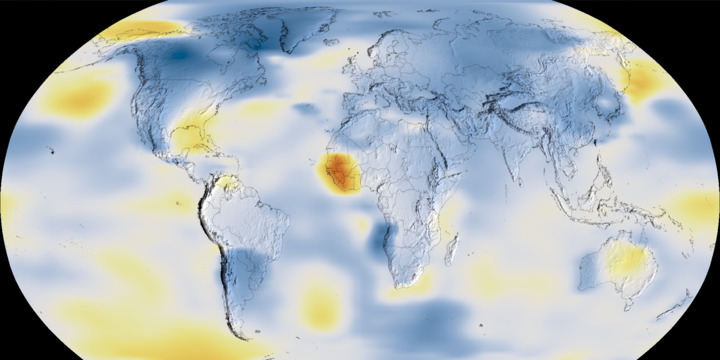
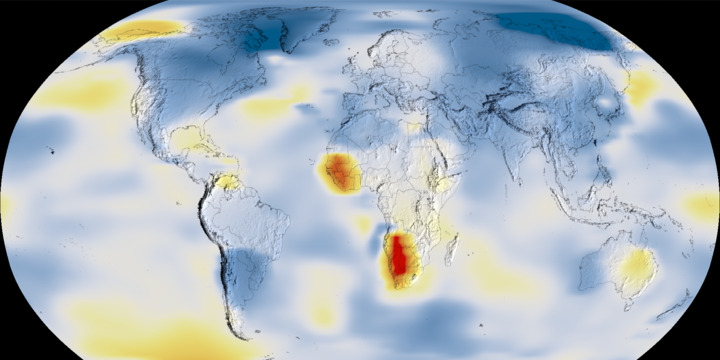
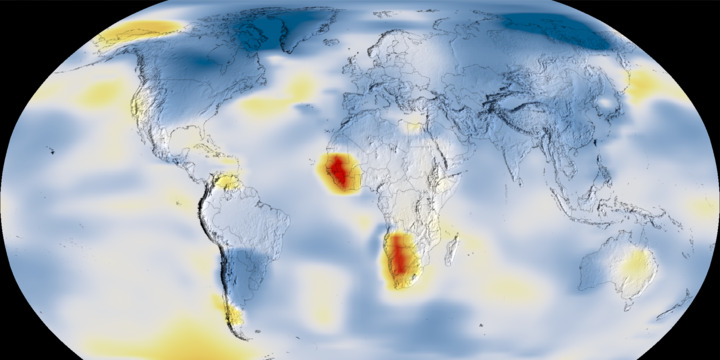
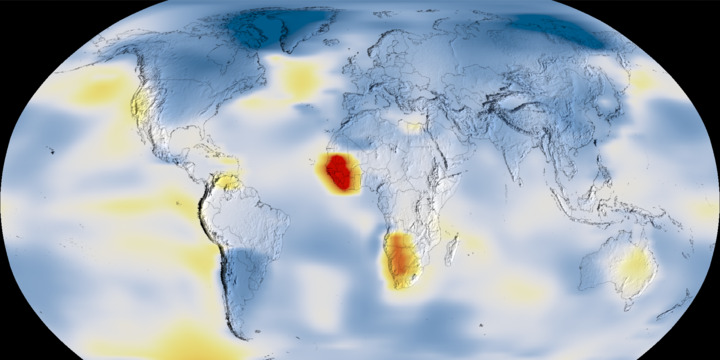
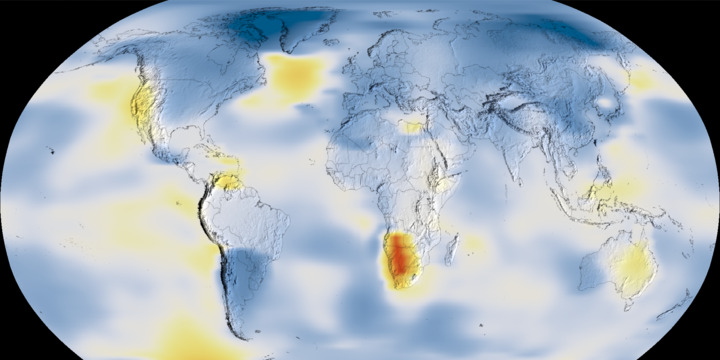
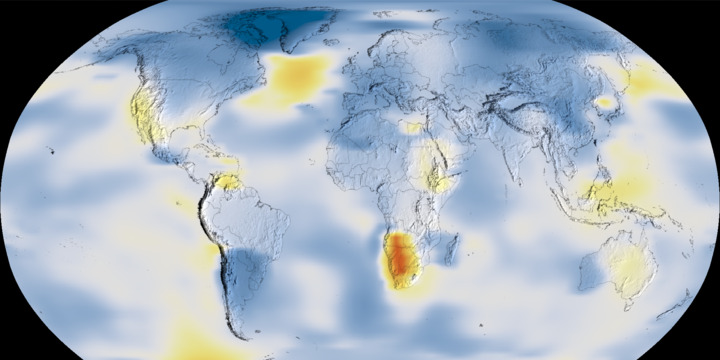
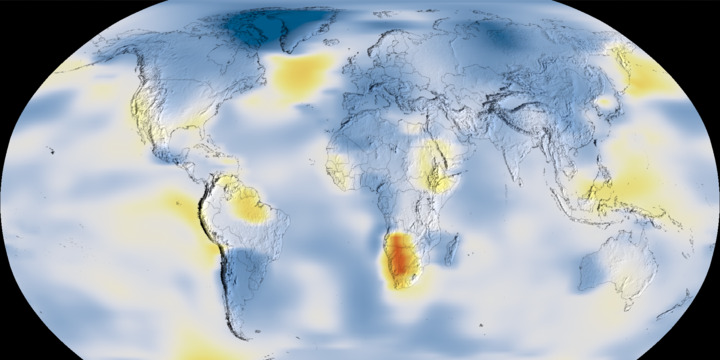
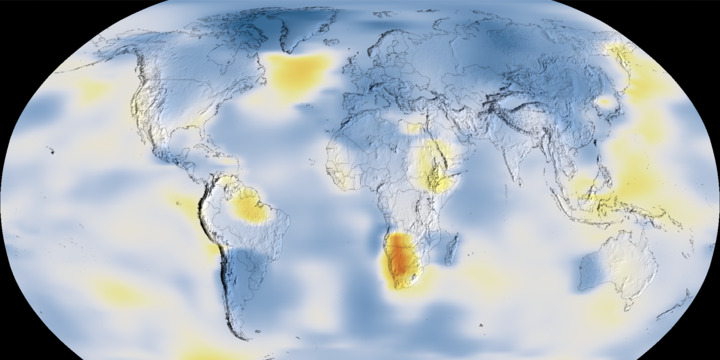
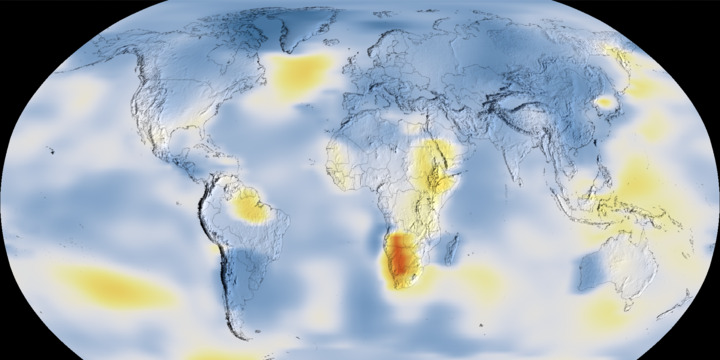
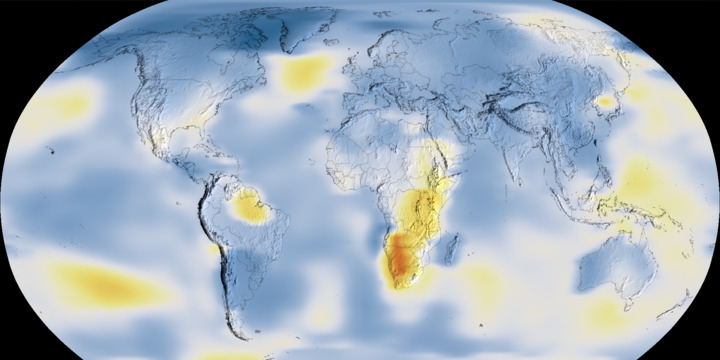
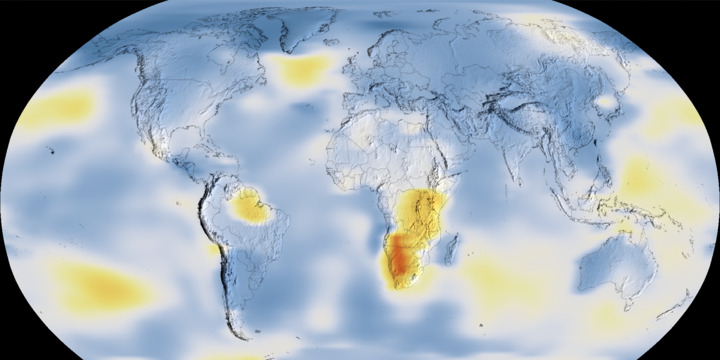
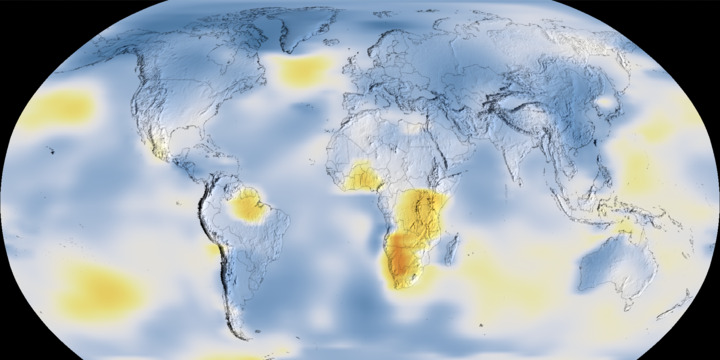
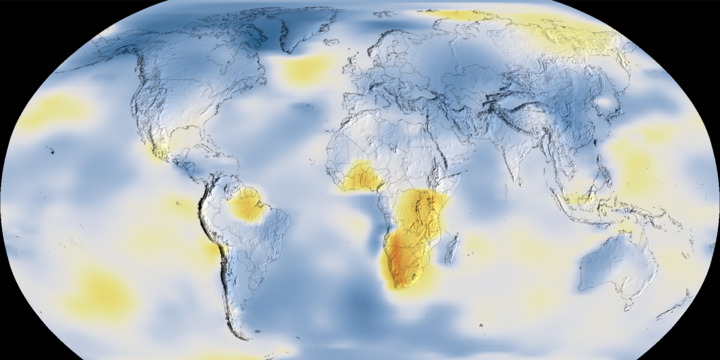
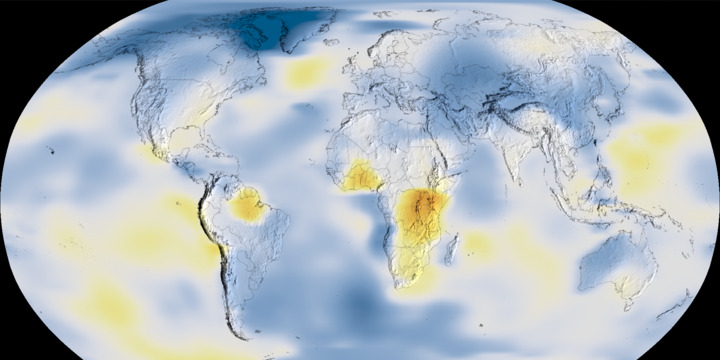
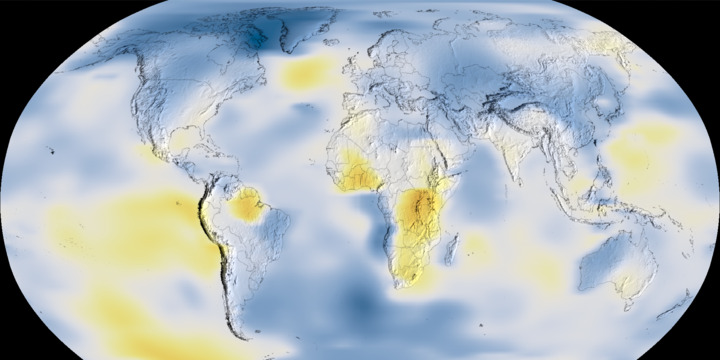
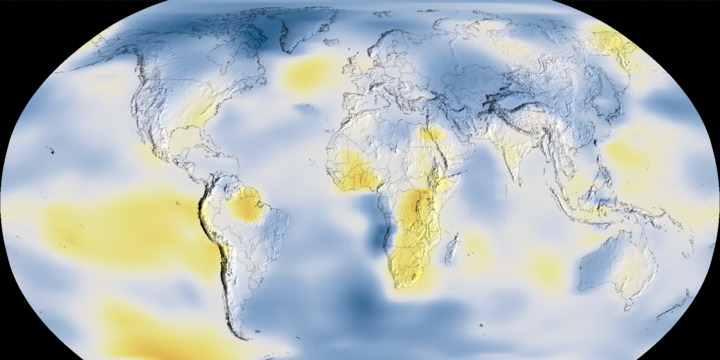
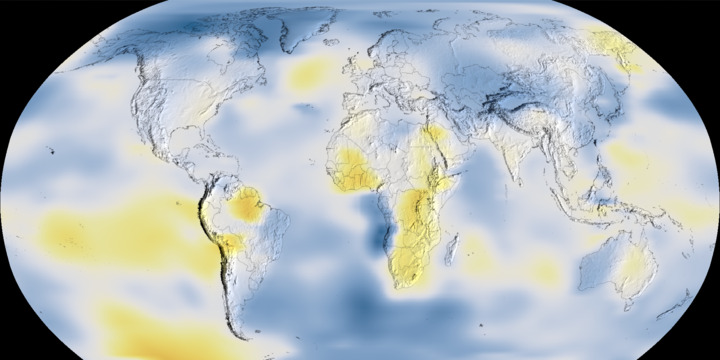
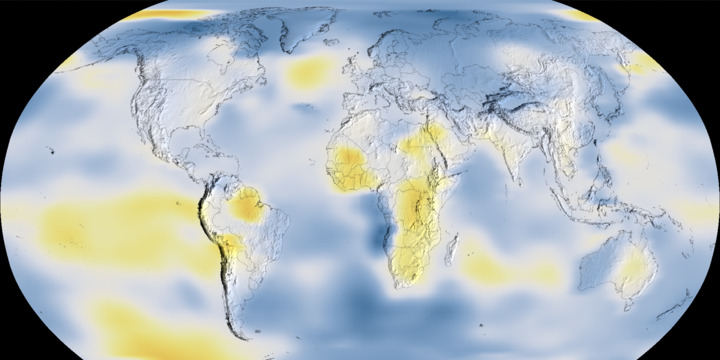
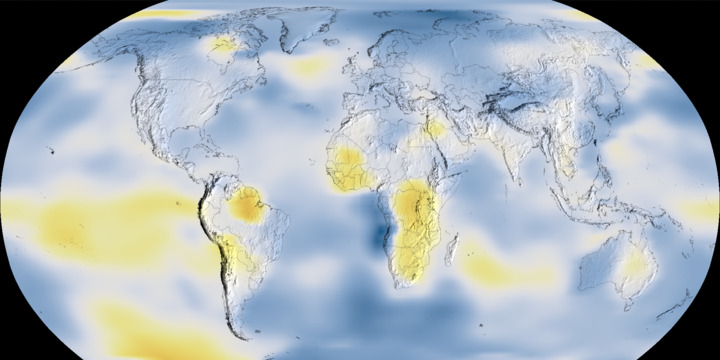
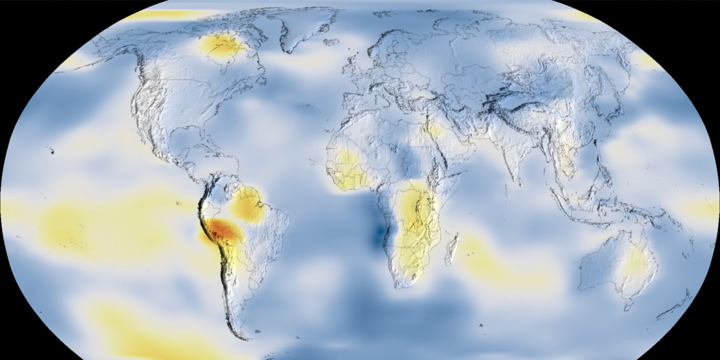
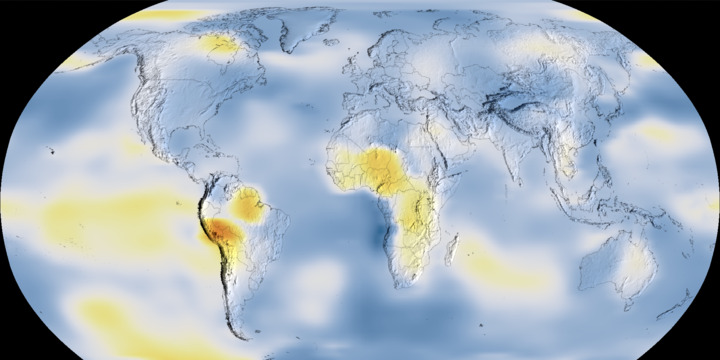
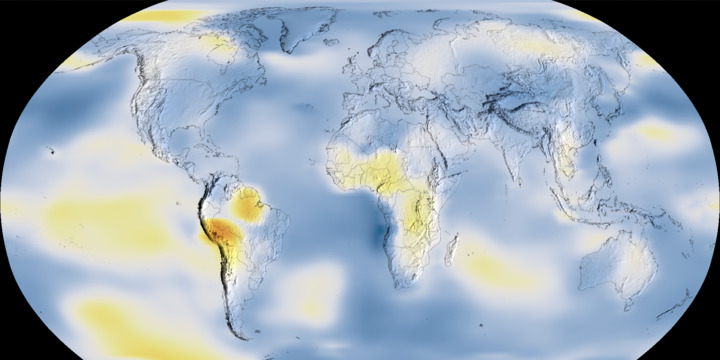
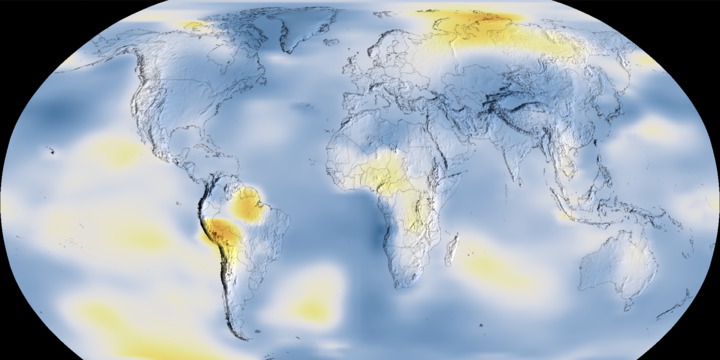
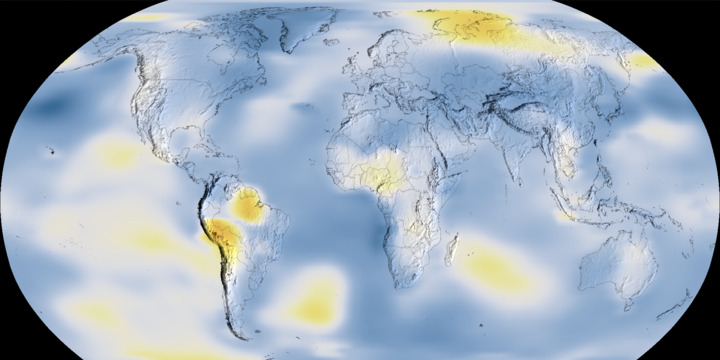
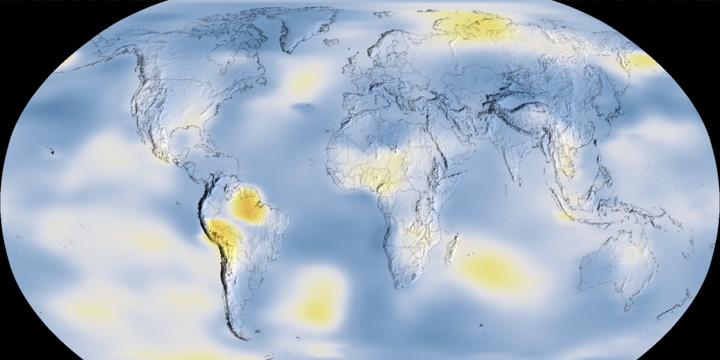
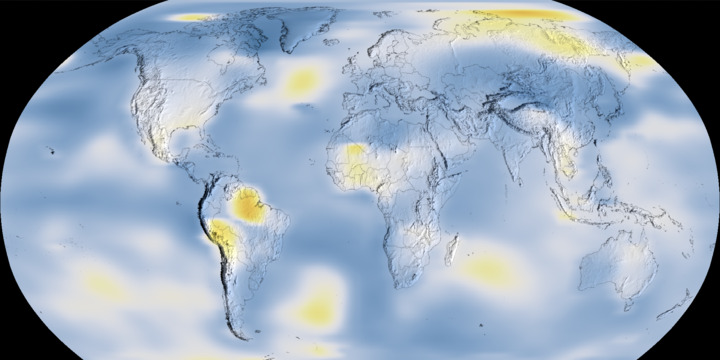
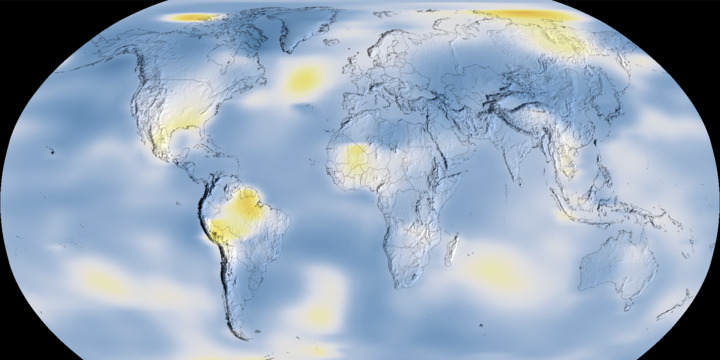
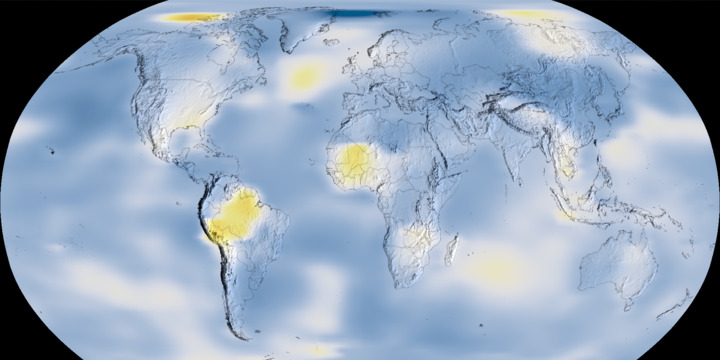
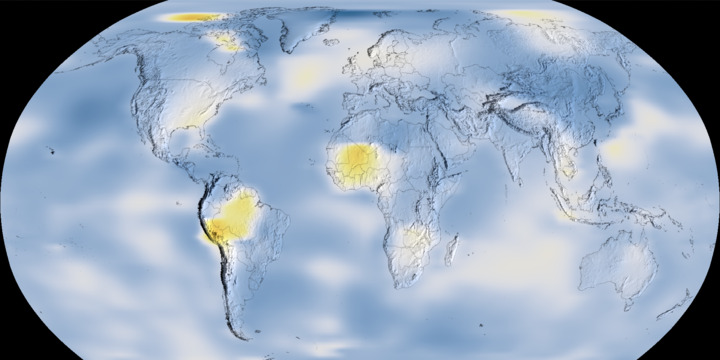
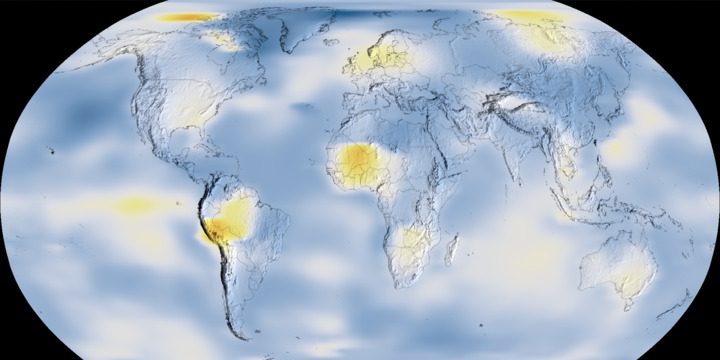
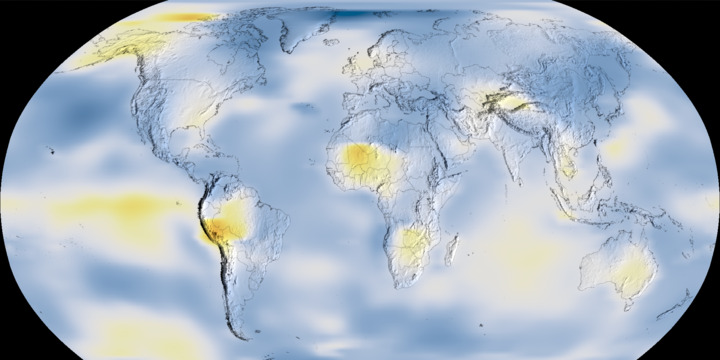
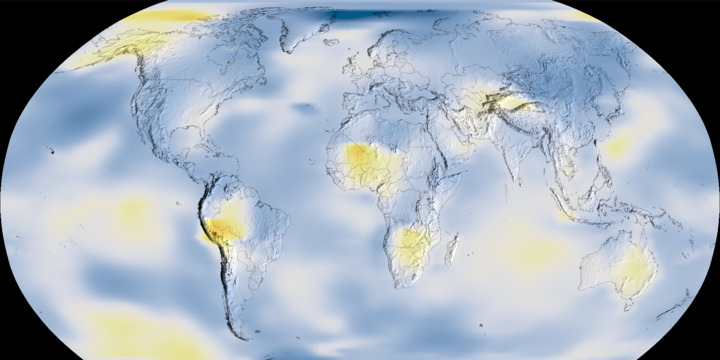
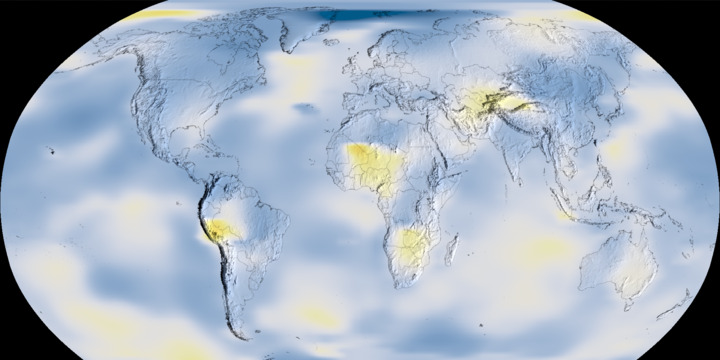
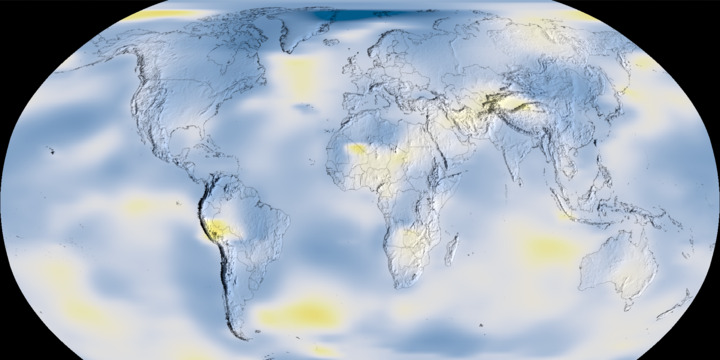
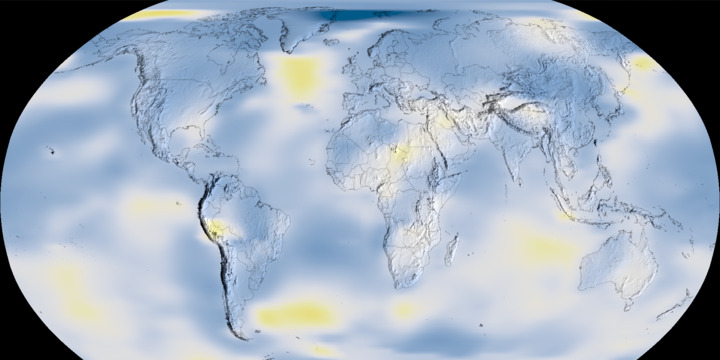
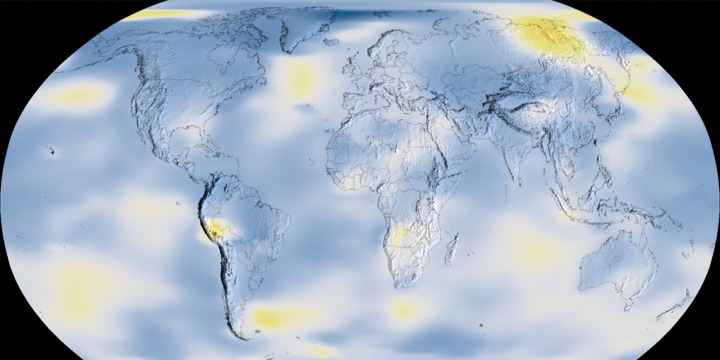
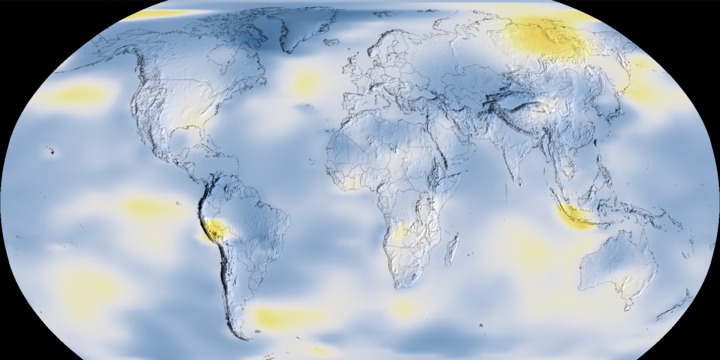
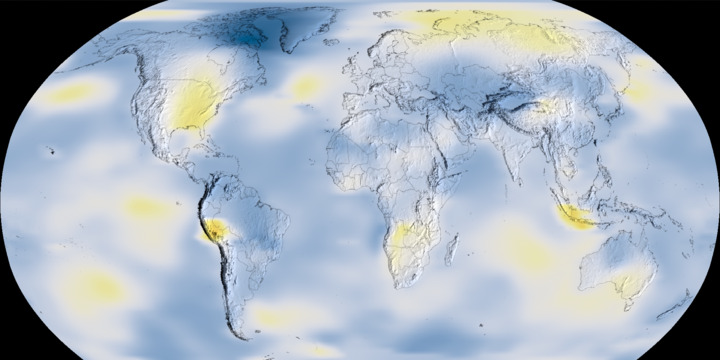
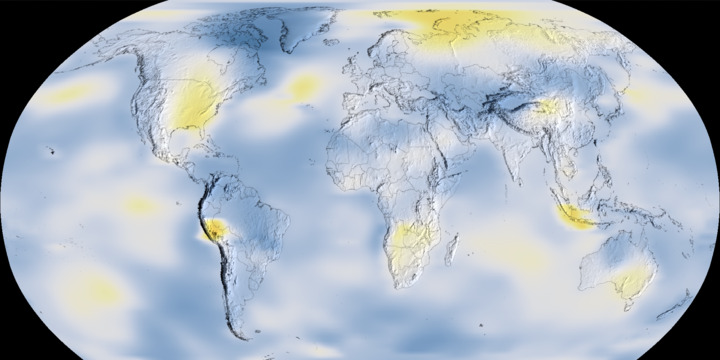
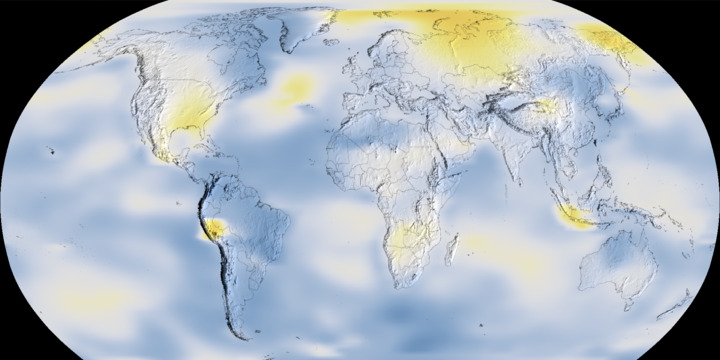
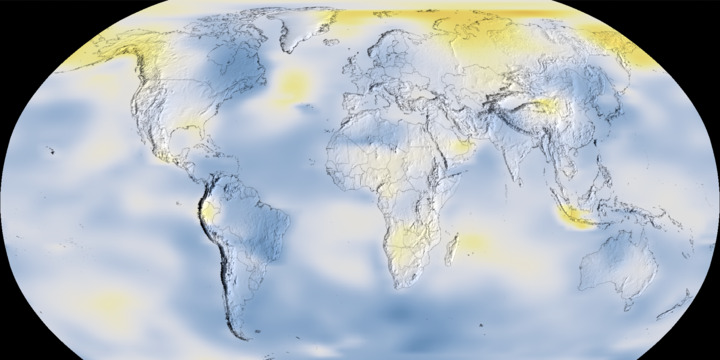
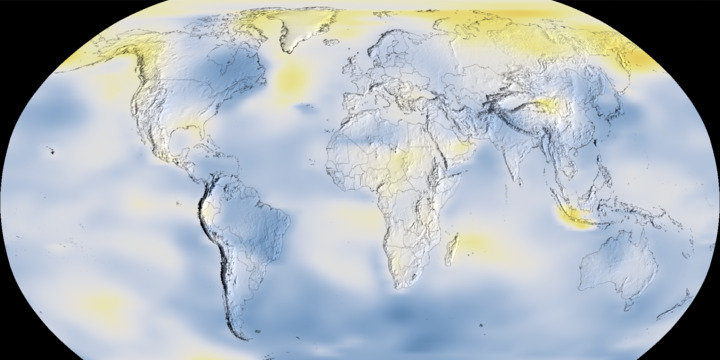
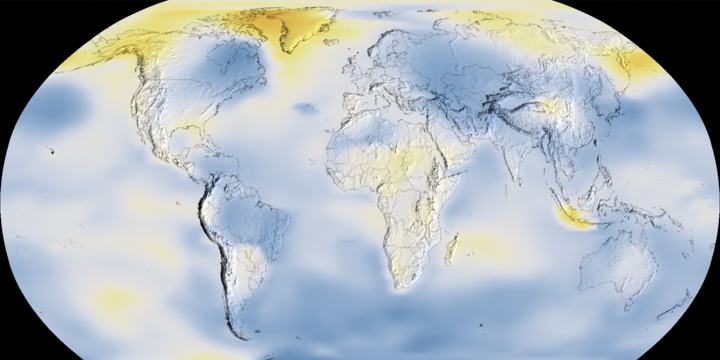
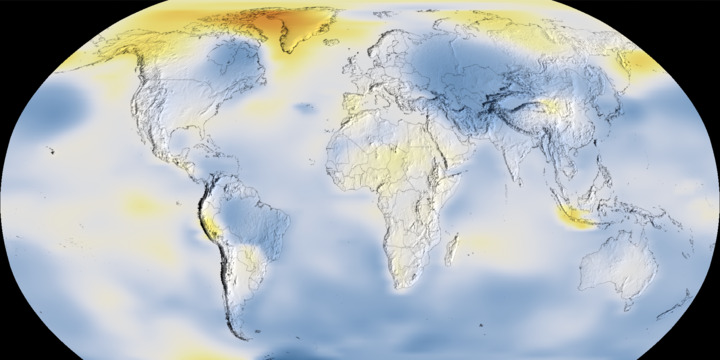
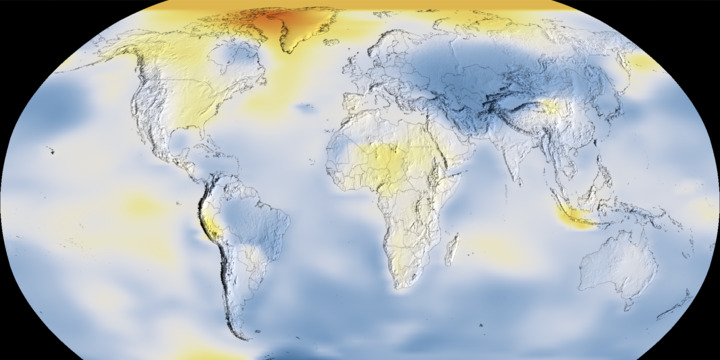
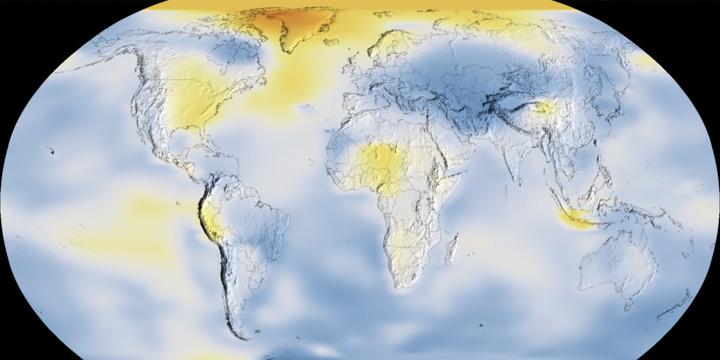
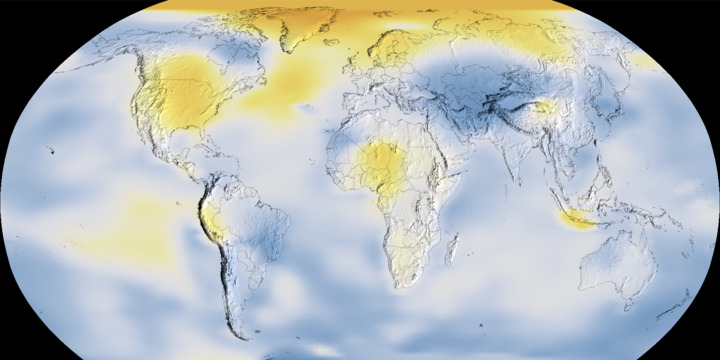
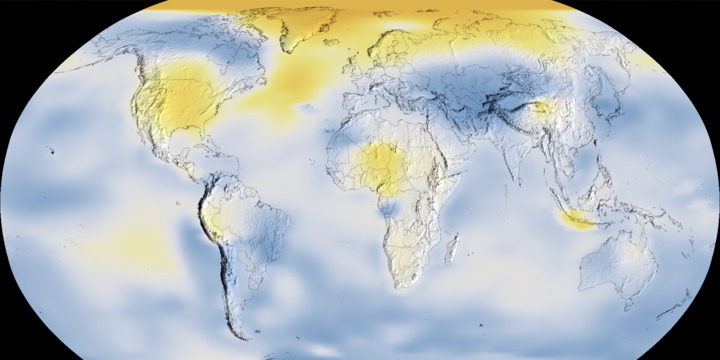
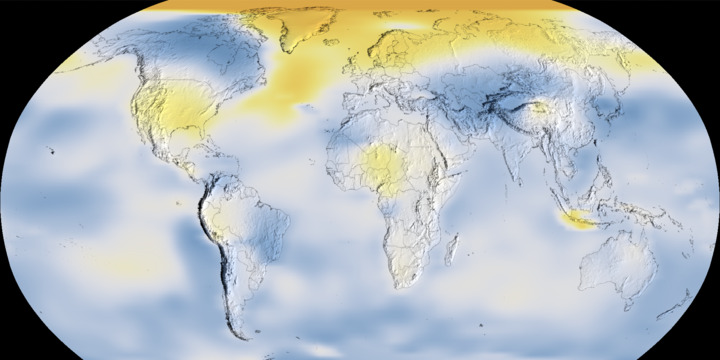
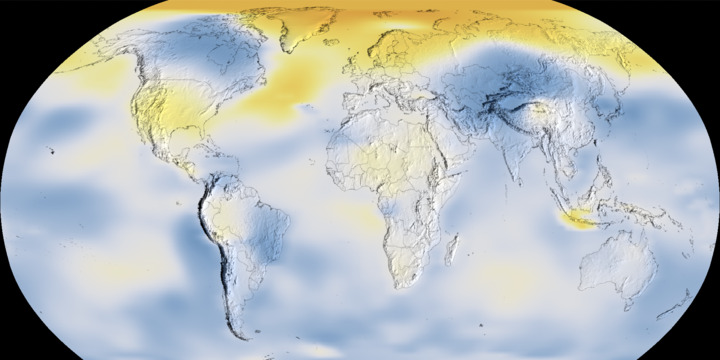
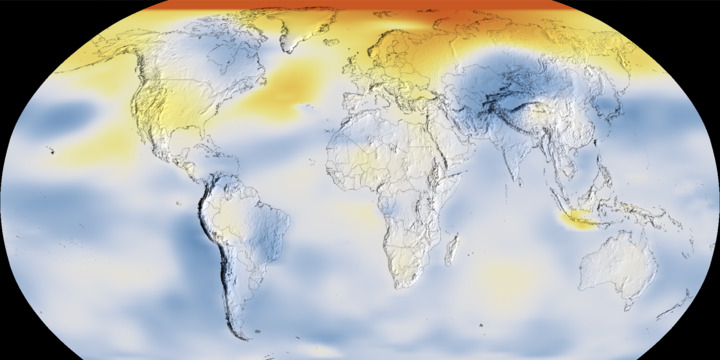
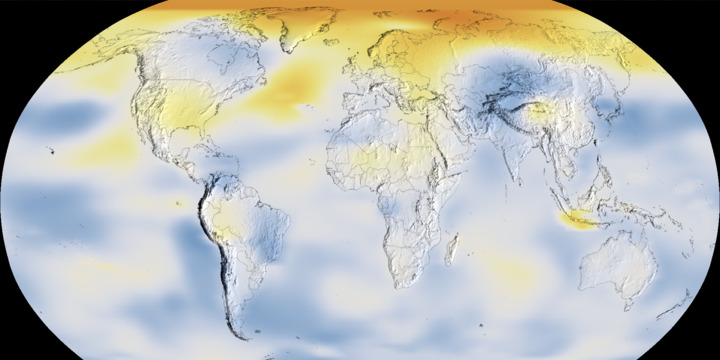
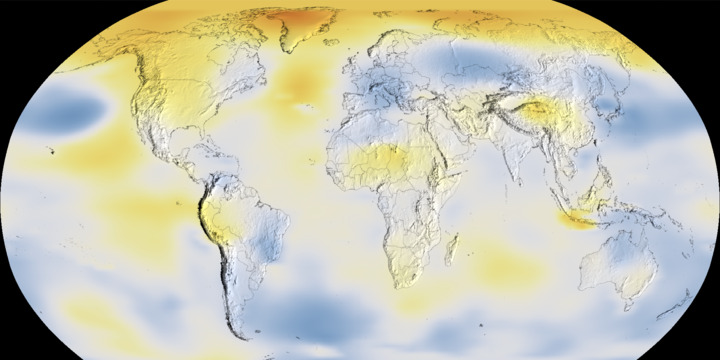
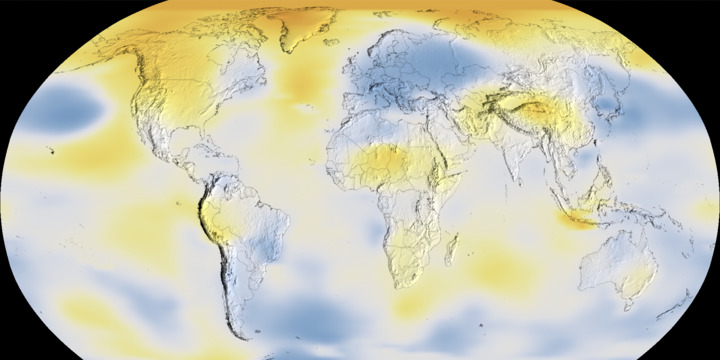
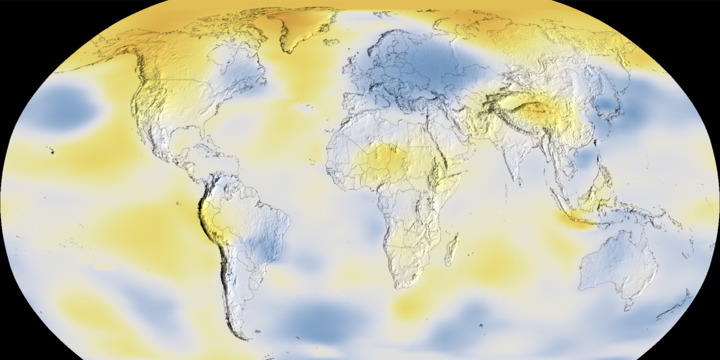
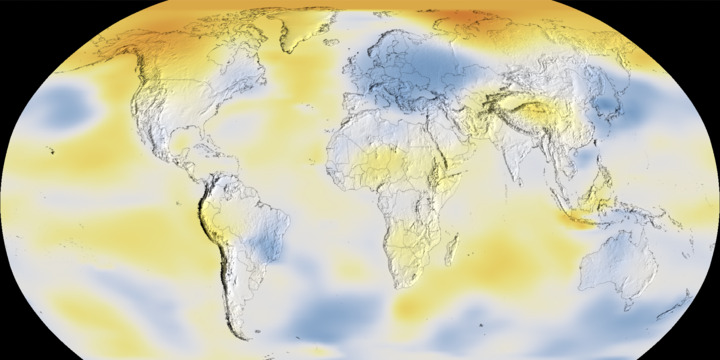
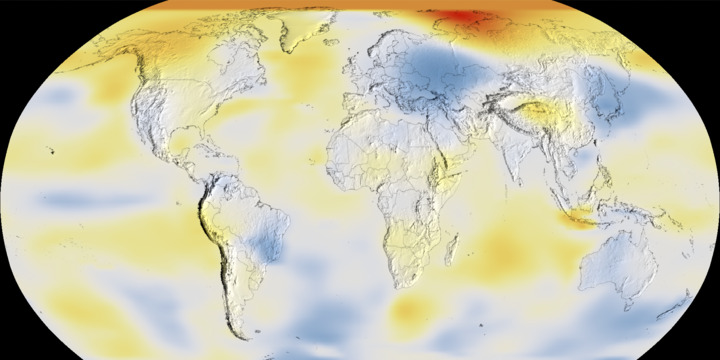
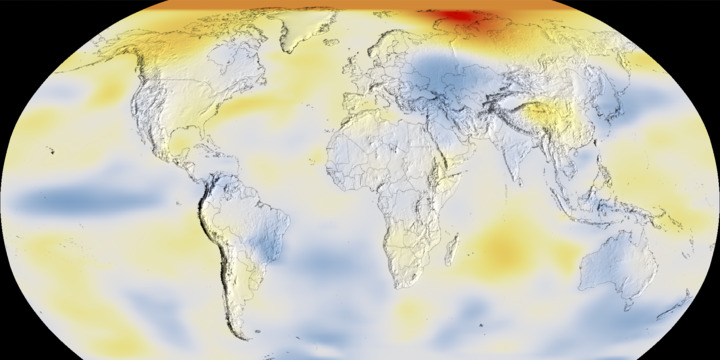
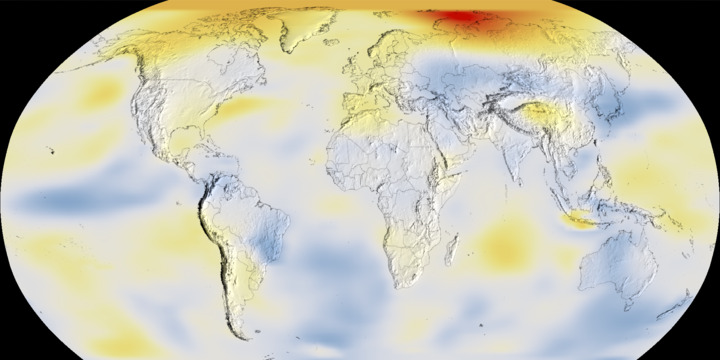
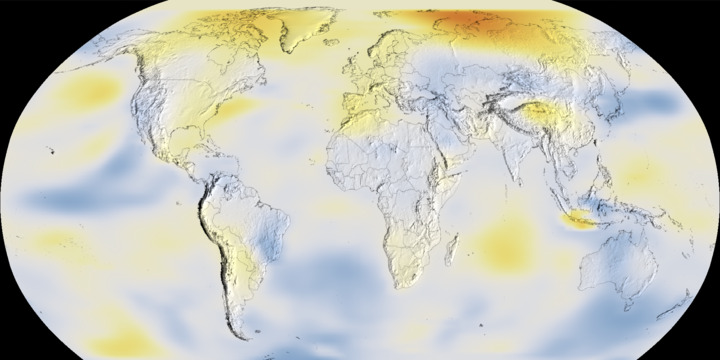
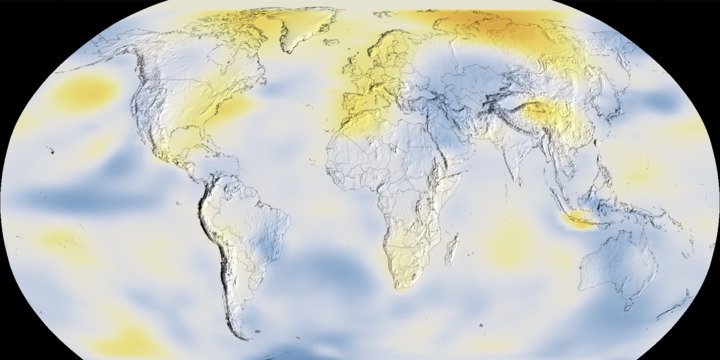
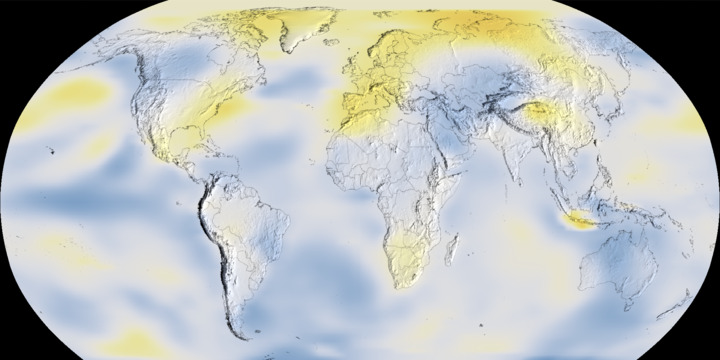
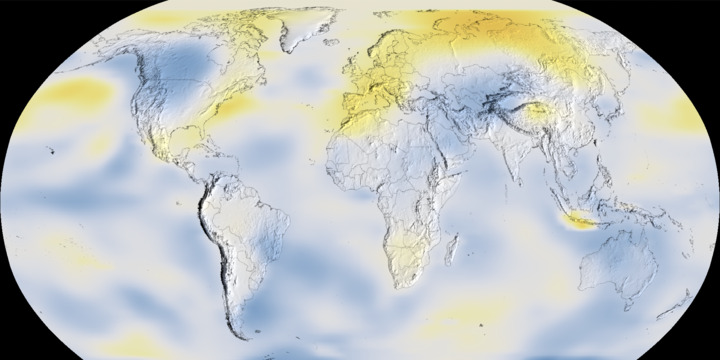
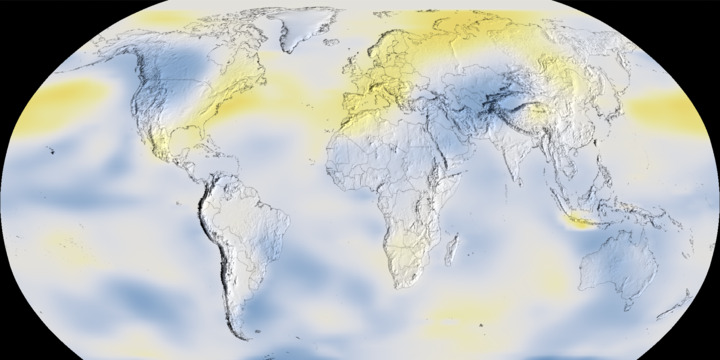
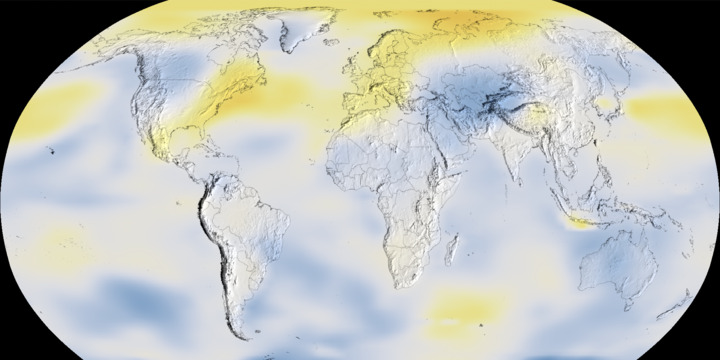
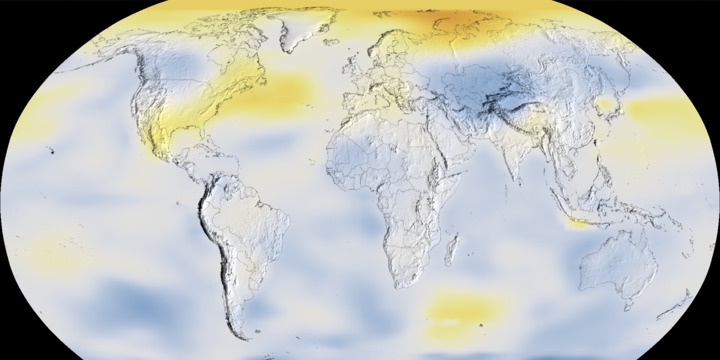
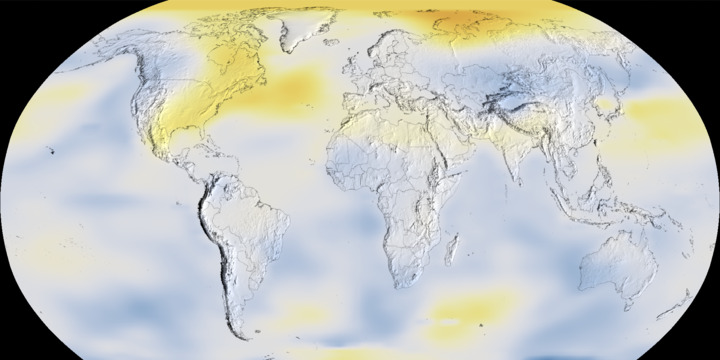
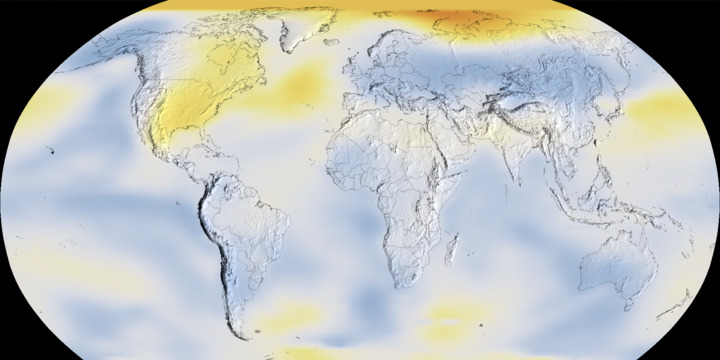
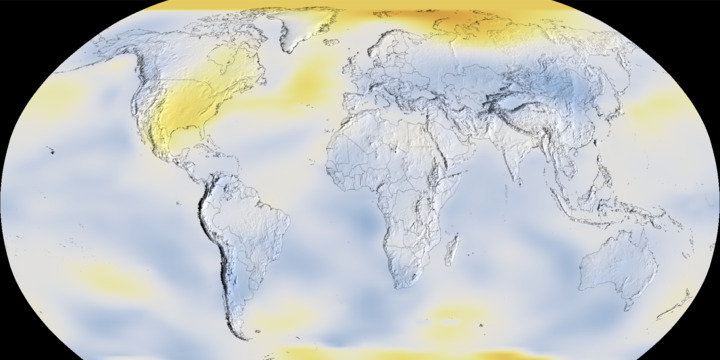
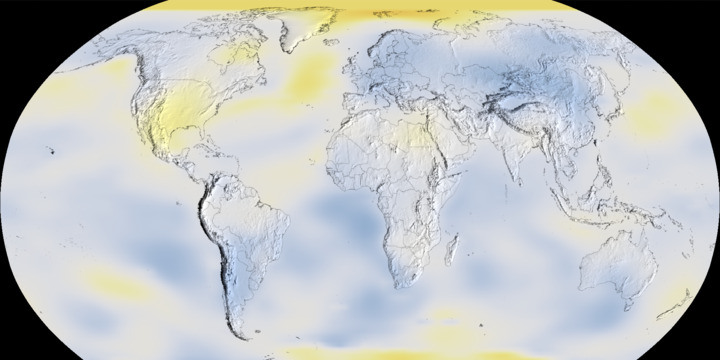
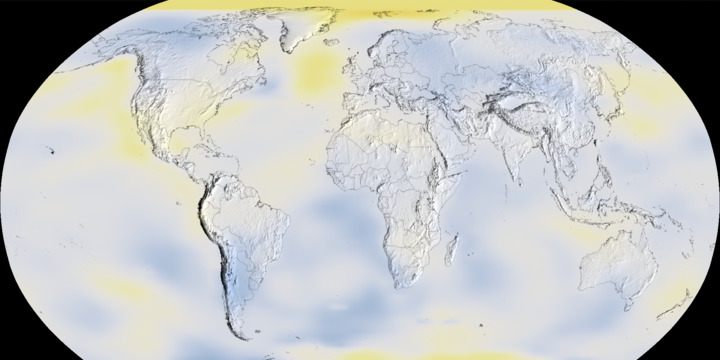
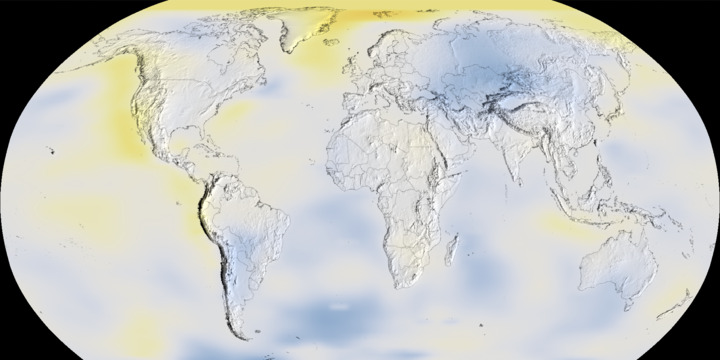
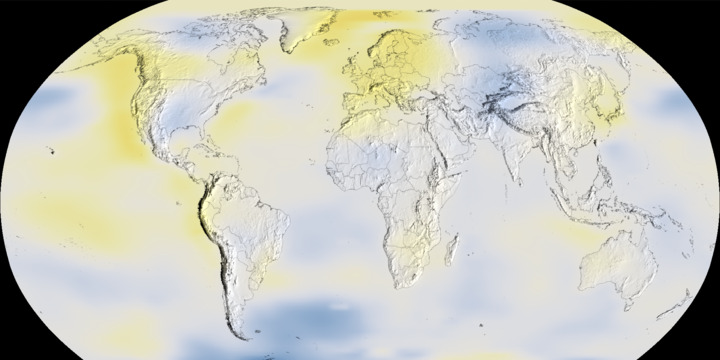
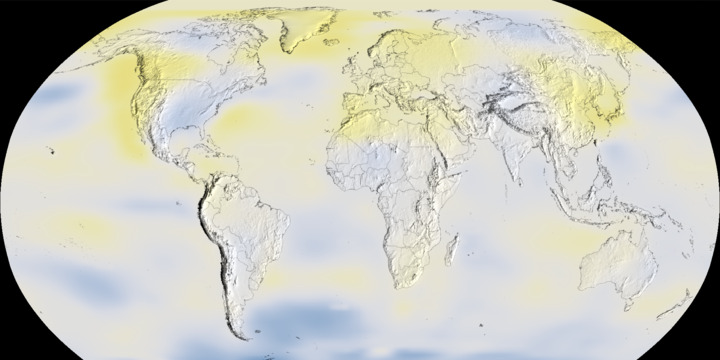
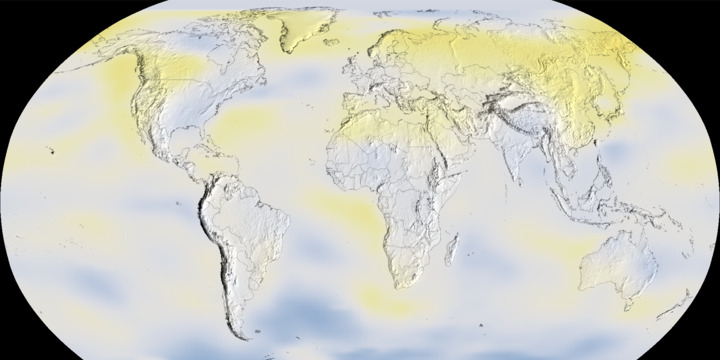
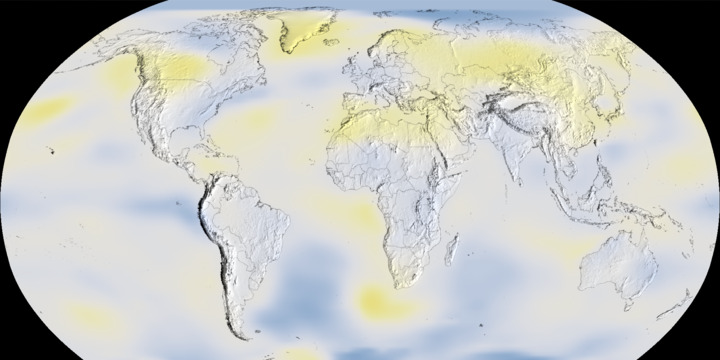
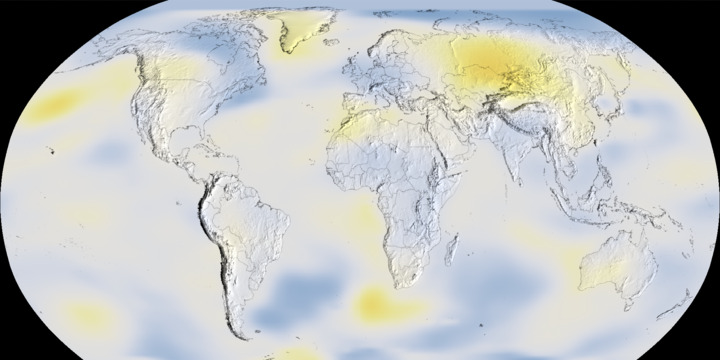
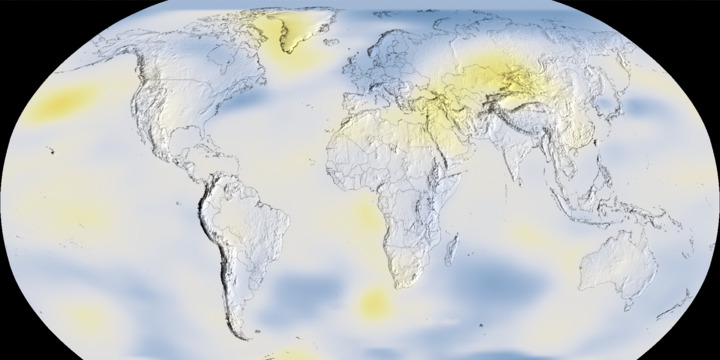
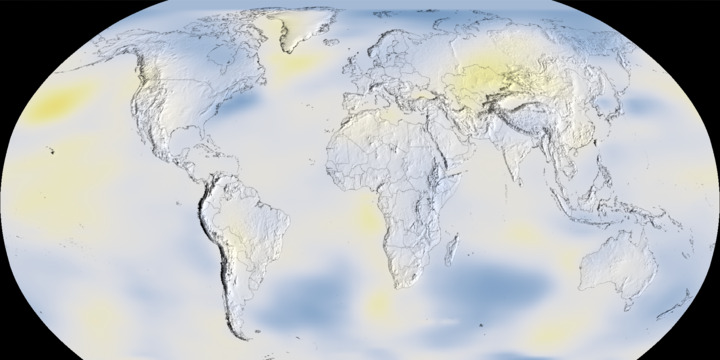
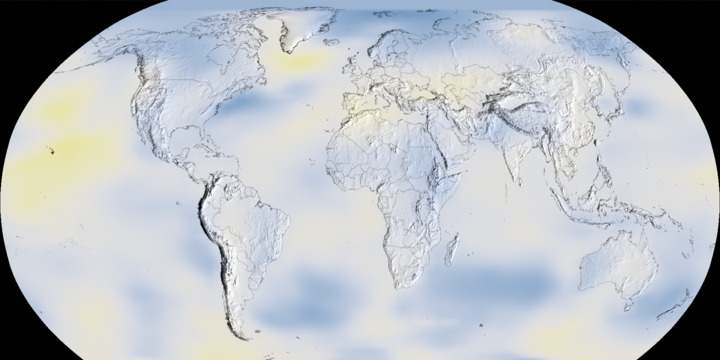
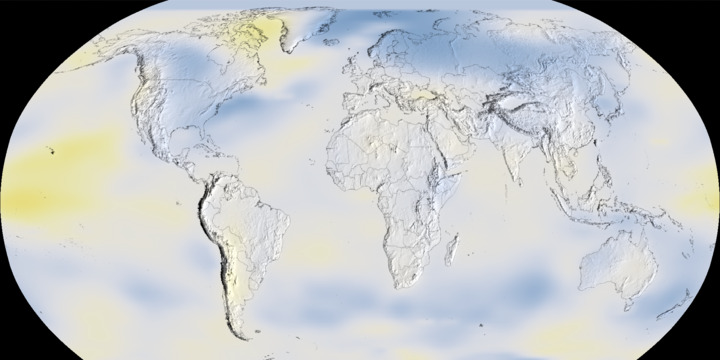
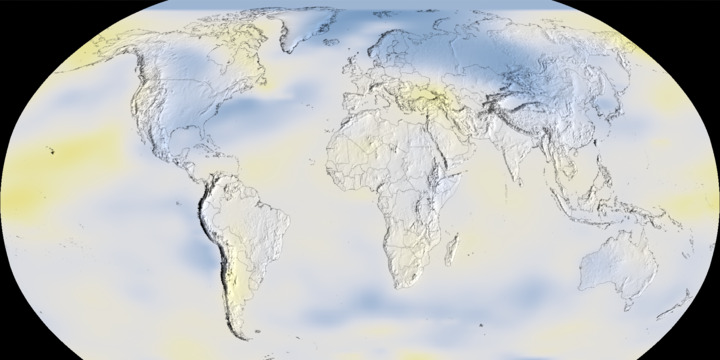
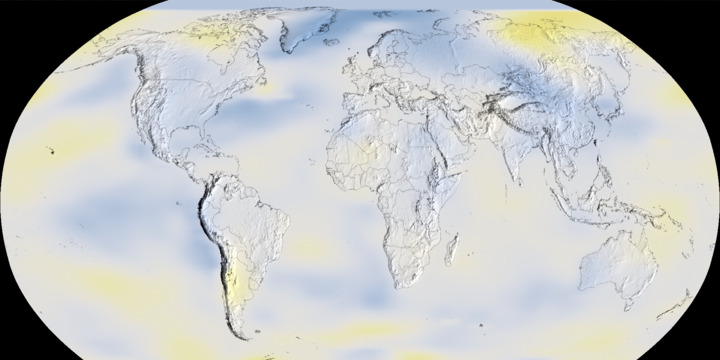
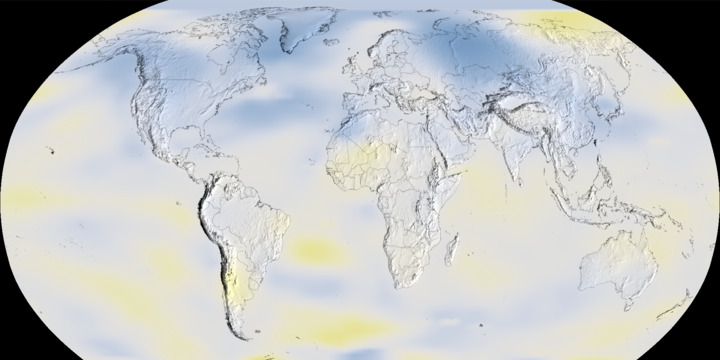
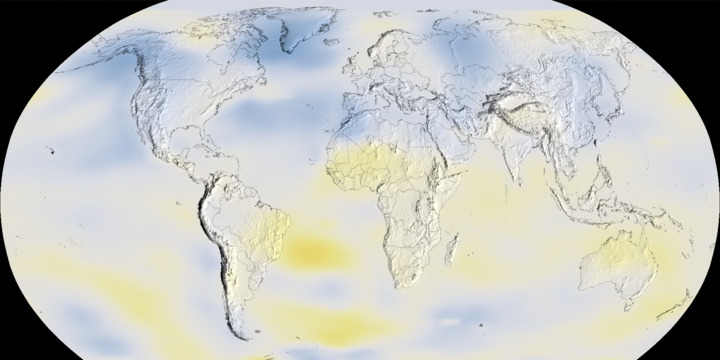
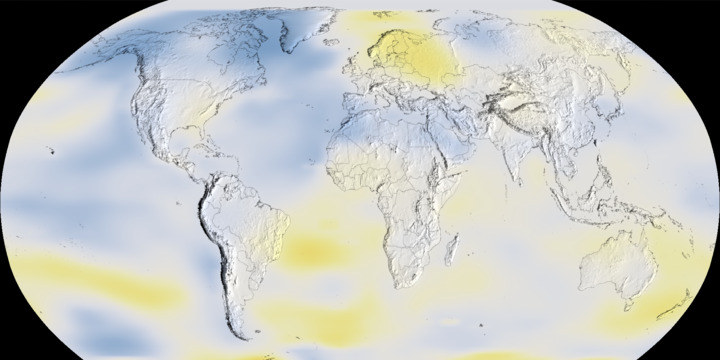
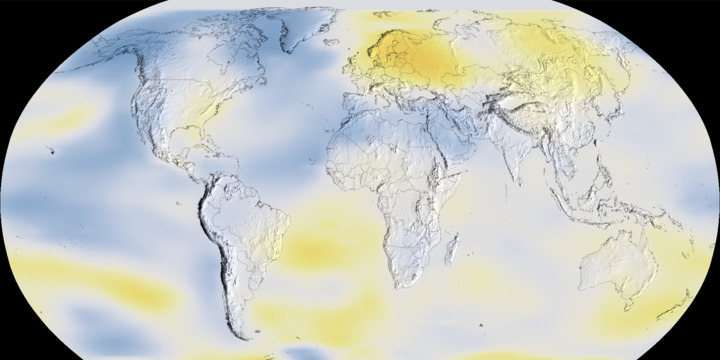
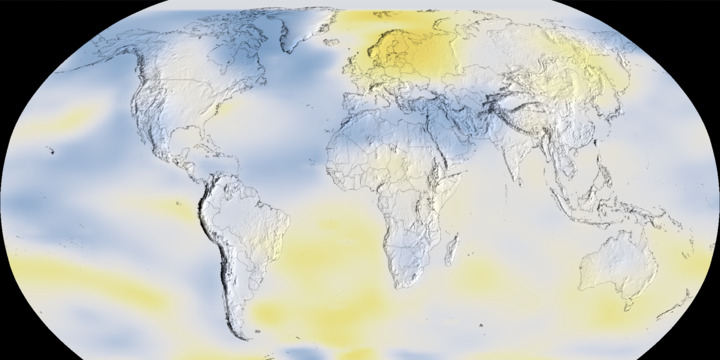
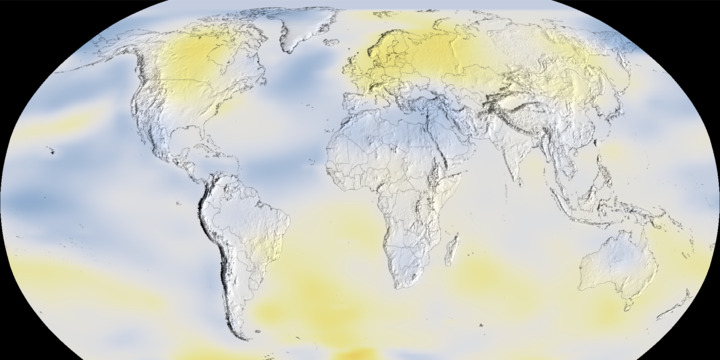
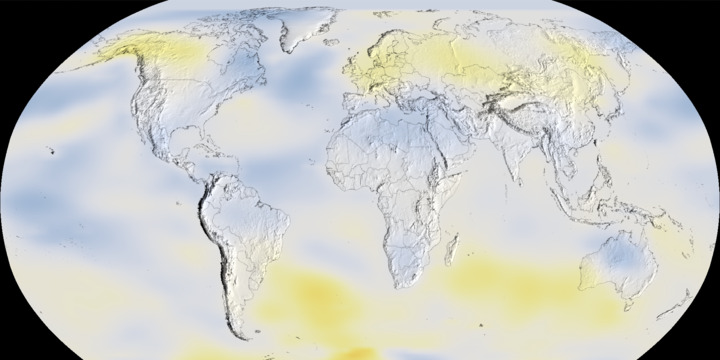
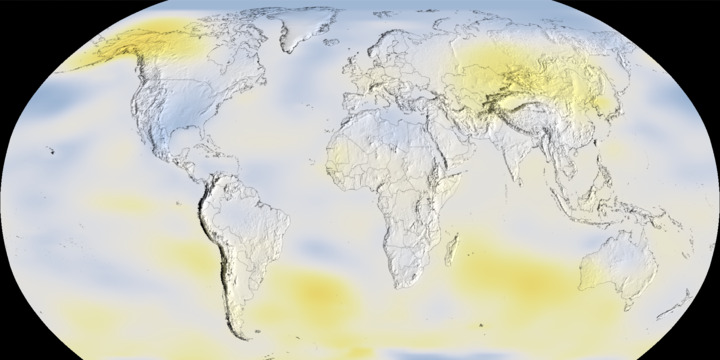
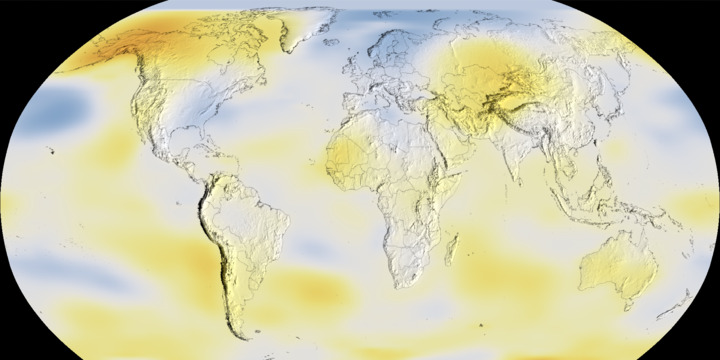
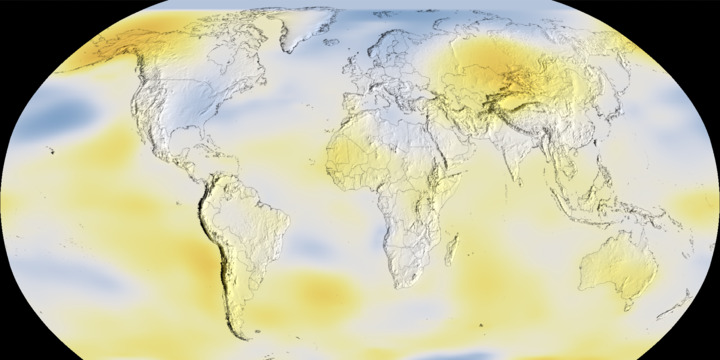
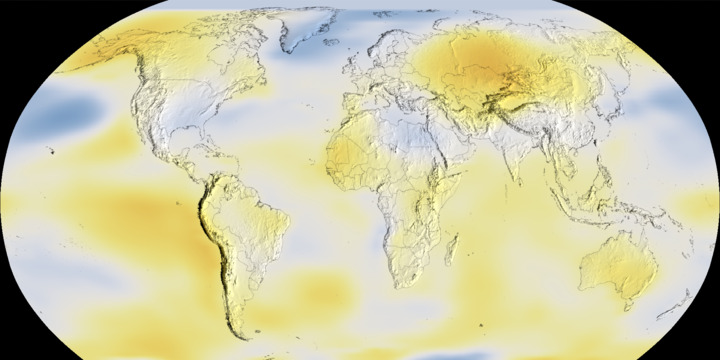
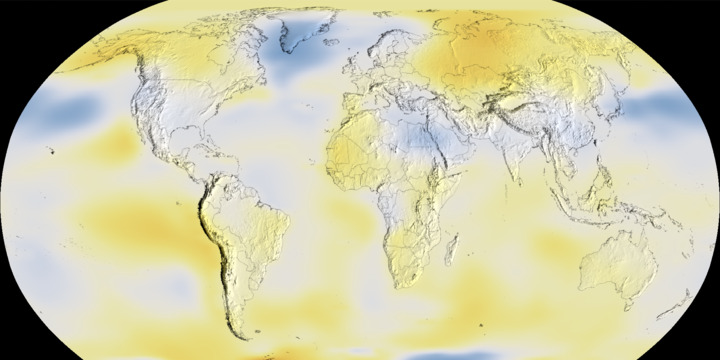
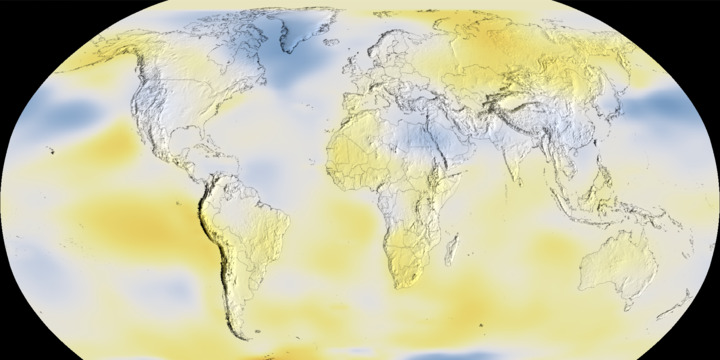
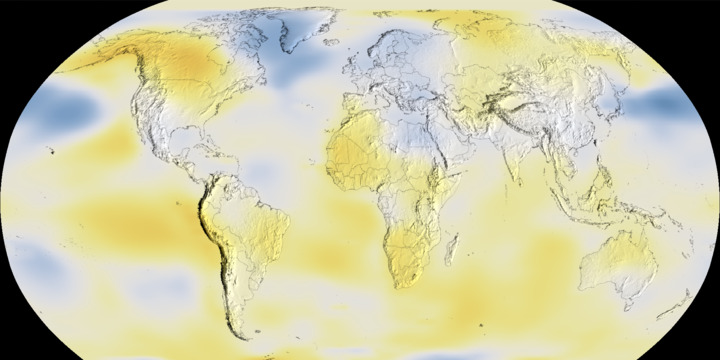
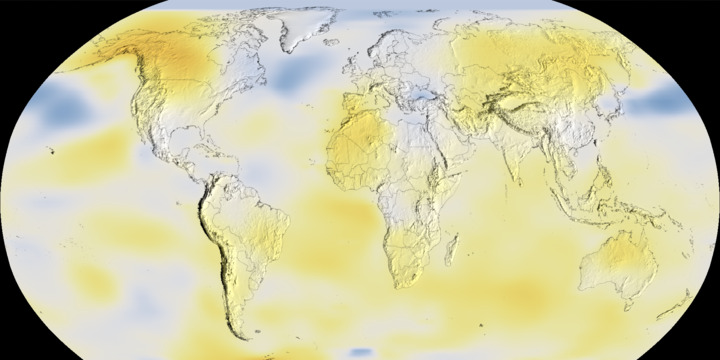
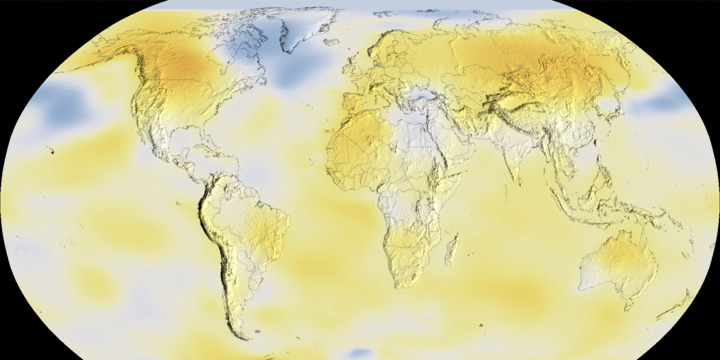
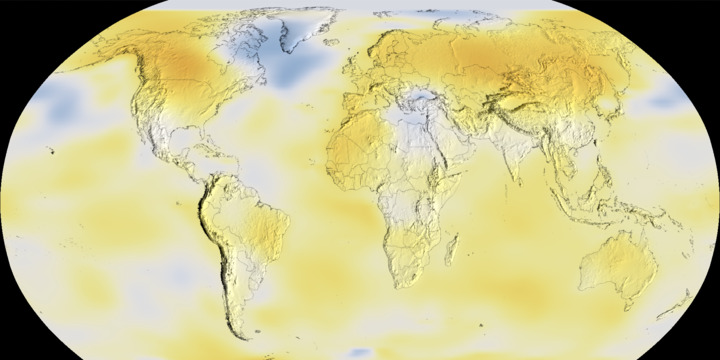
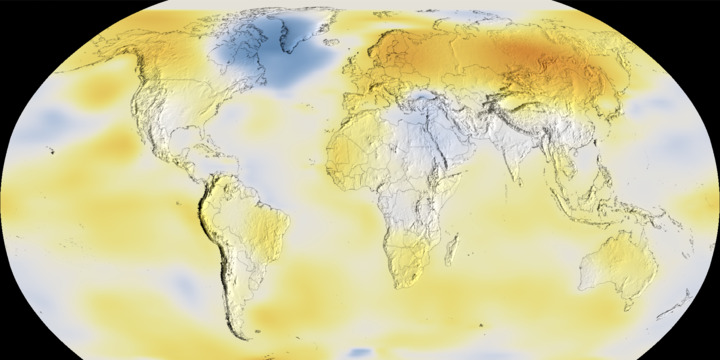
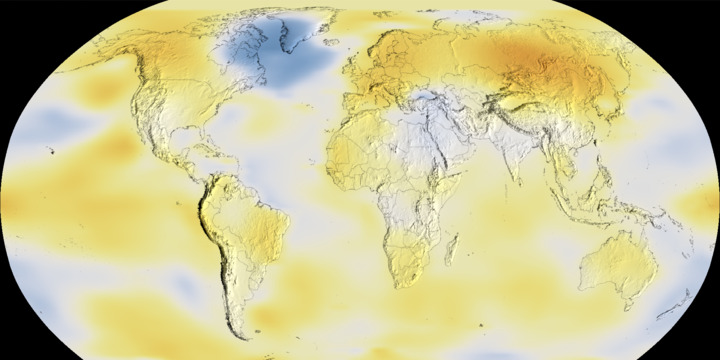
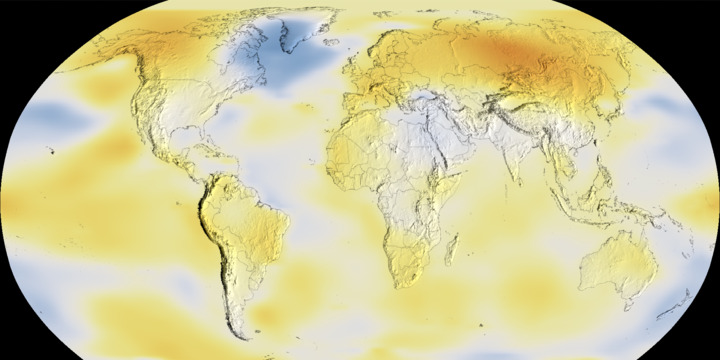
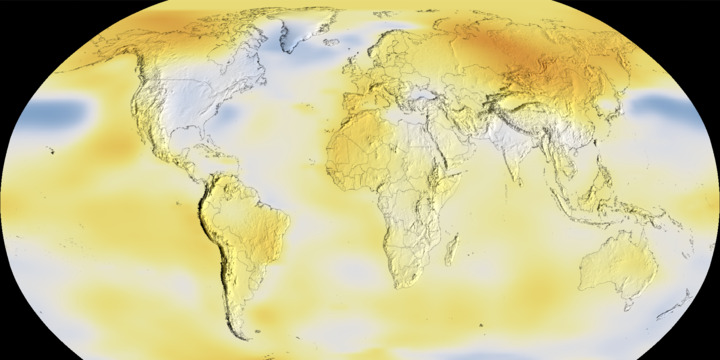
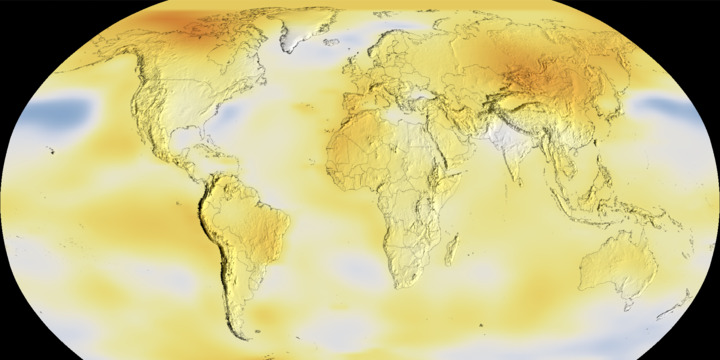
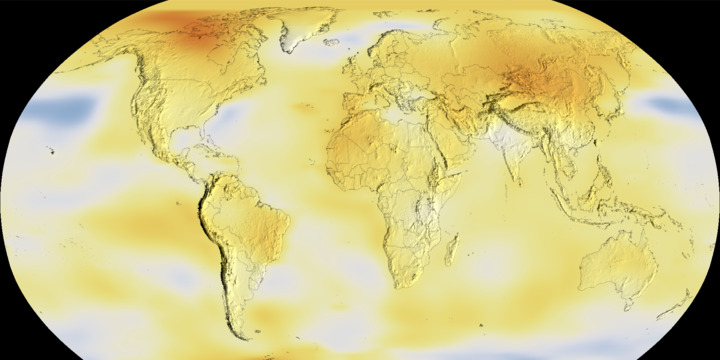
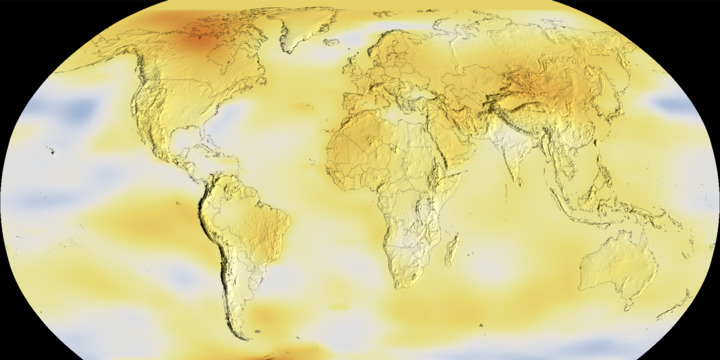
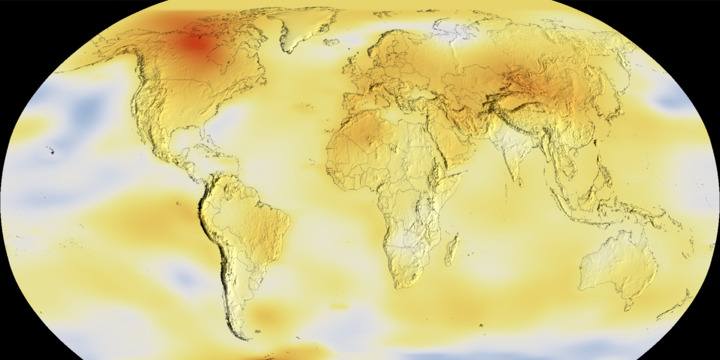
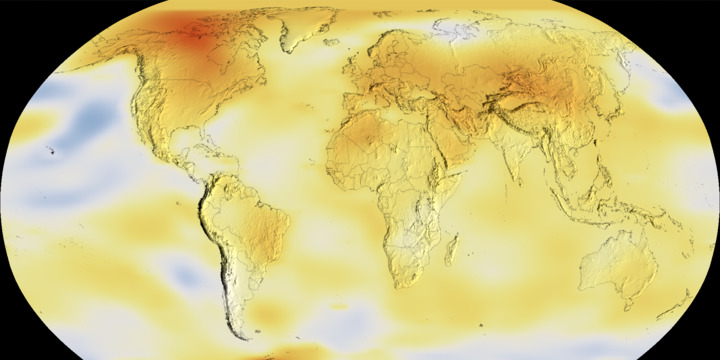
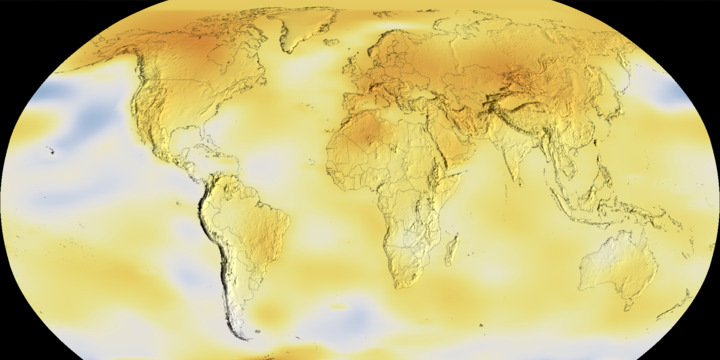
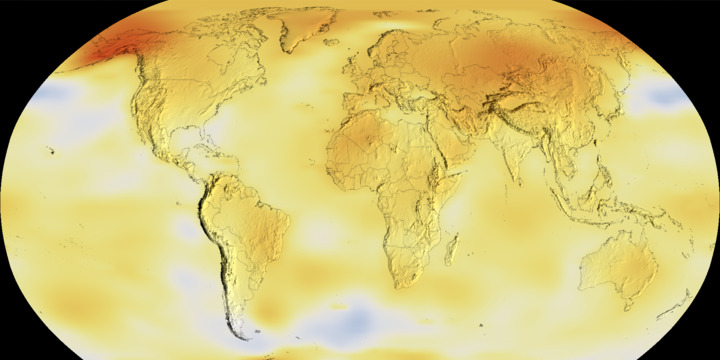
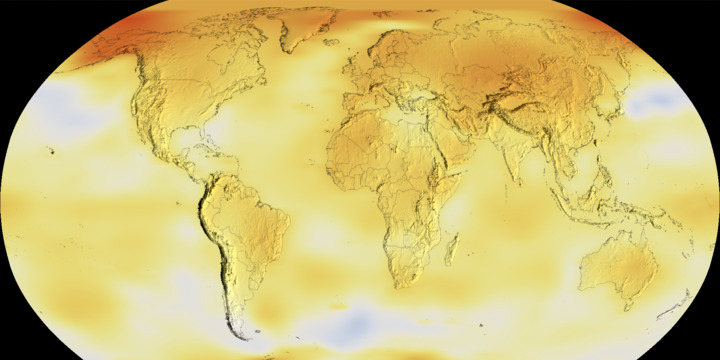
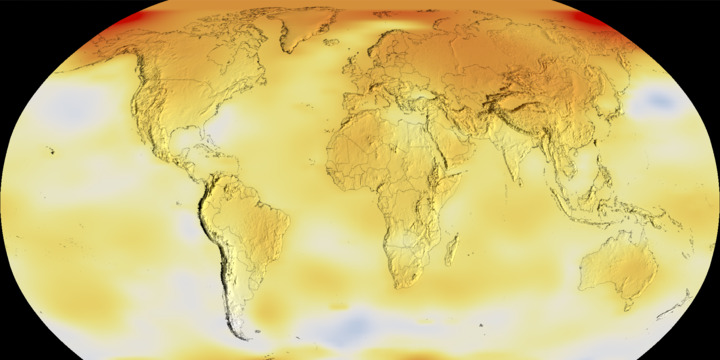
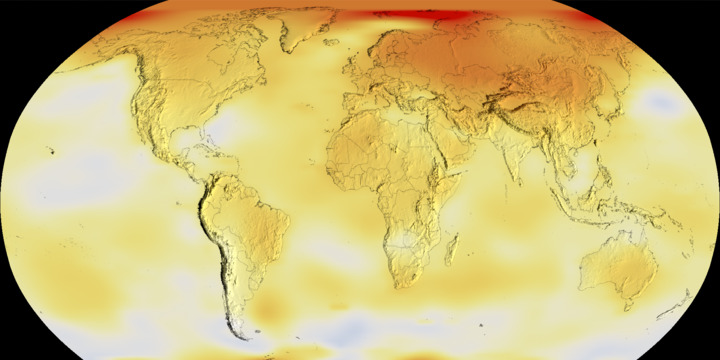
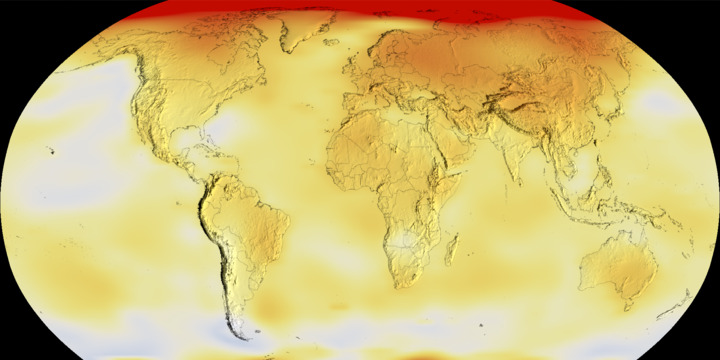
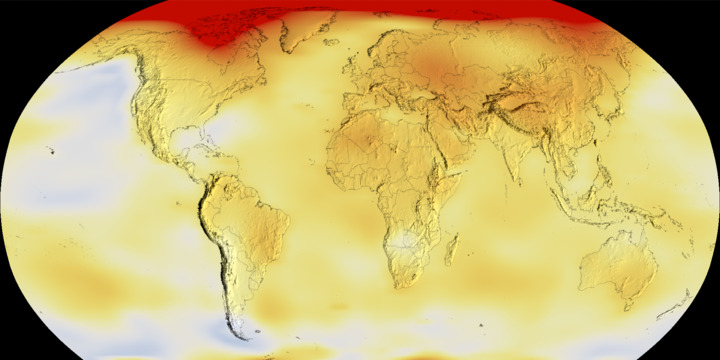
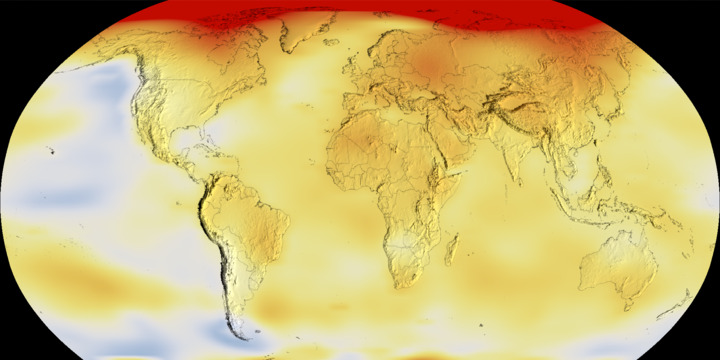
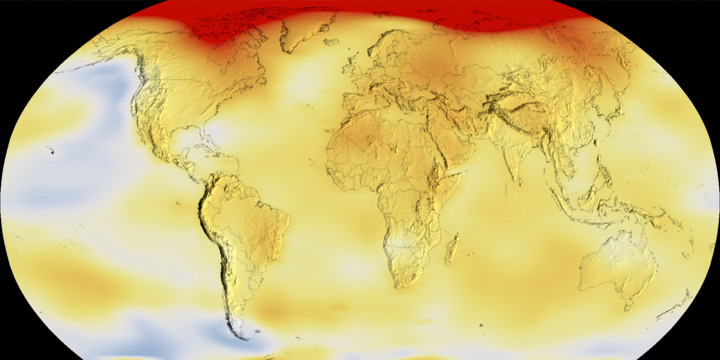
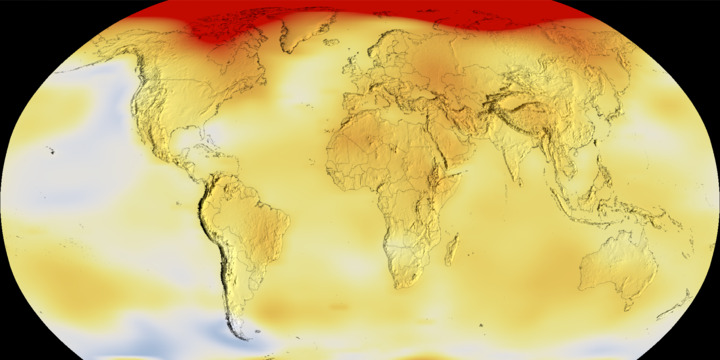
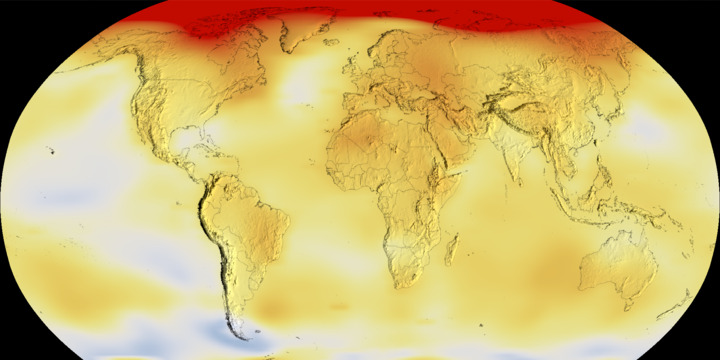
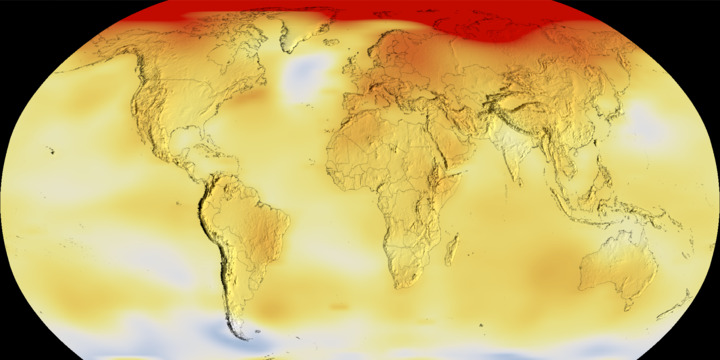
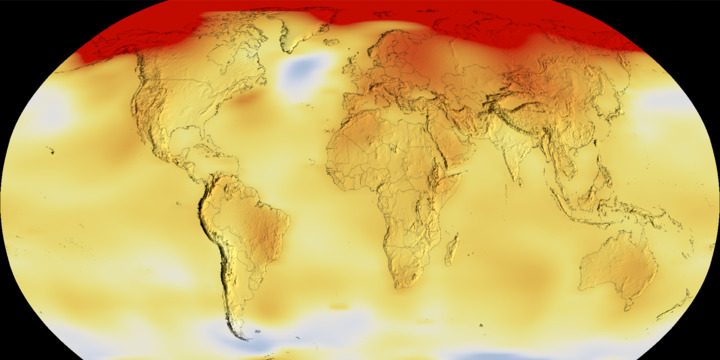
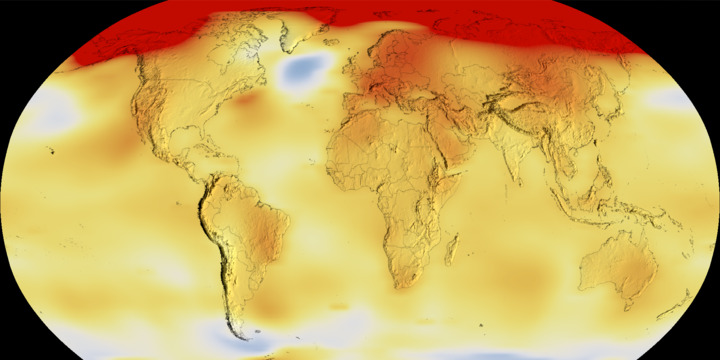
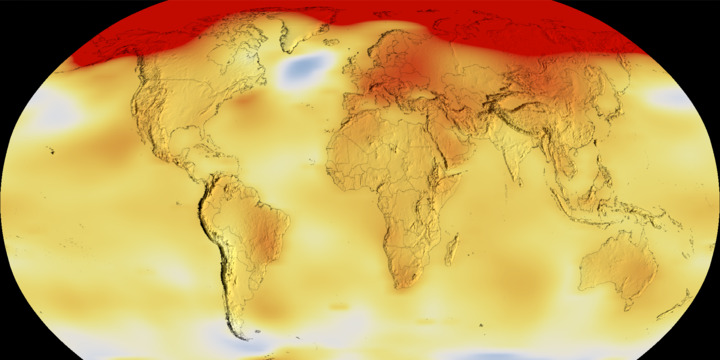
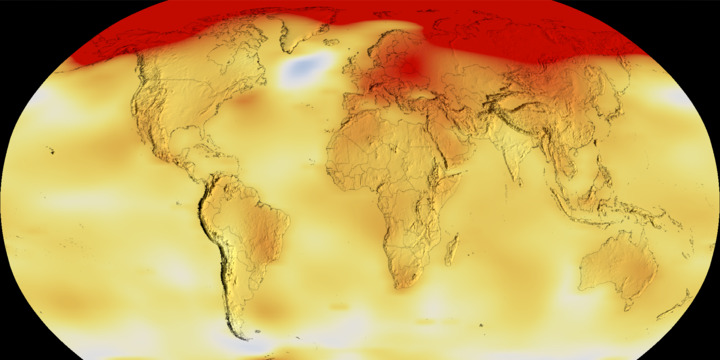
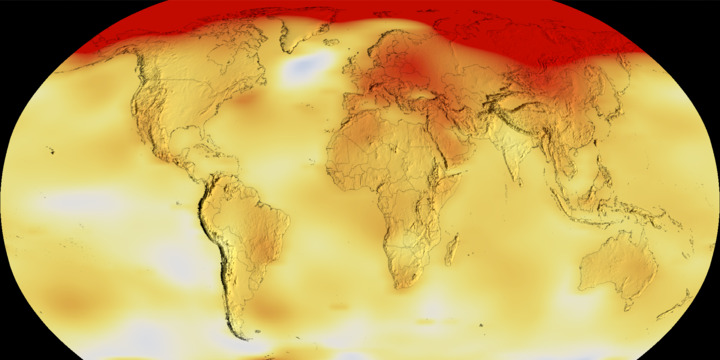
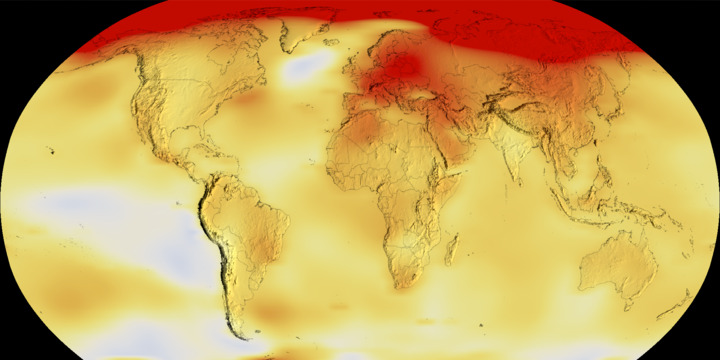
The animation on the right shows the change in global surface temperatures. Dark blue shows areas cooler than average. Dark red shows areas warmer than average. Short-term variations are smoothed out using a 5-year running average to make trends more visible in this map.
The data shown are the latest available, updated annually.
GLOBAL LAND-OCEAN TEMPERATURE INDEX
Time Series: 1884 to 2022
Credit: NASA's Scientific Visualization Studio