|
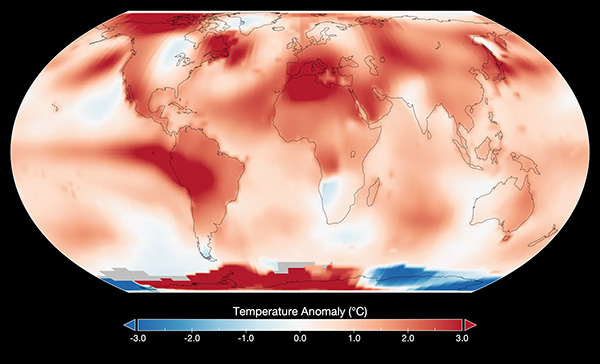
Update: Carbon Dioxide Concentration
July's global average atmospheric carbon dioxide (CO2) was about 422 parts per million (ppm), an almost 52% increase since 1750. This rise is mainly due to human activities such as burning fossil fuels.
New Visualization: Greenland Ice Mass Loss (2002-2023)
This ice sheet shed about 270 billion metric tons of ice per year between 2002 and 2023, adding to sea level rise. Click to see an updated data visualization of these changes based on satellite observations.
New Visualization: Antarctic Ice Mass Loss (2002-2023)
Between 2002 and 2023, this ice sheet lost about 150 billion metric tons of ice, also contributing to sea level rise. Watch and download the video at the link above.
Climate Change Effects
As a result of human actions on our climate, we are seeing more sea level rise, ice melt, extreme events, and other effects, which will intensify if emissions continue to rise. Visit the link above to learn more.
Climate Change en español
Educators and families: Background articles, vital sign data, FAQs, and more are available in Spanish.
Images of Change: Flooding in Australia's Northern Territory
In early March 2023, several days of stormy weather flooded parts of a northern-central region of Australia, contrasting with the previous year's drier conditions. Visit the link to get the view from space.
Images of Change: Lowering of Lake Kariba, Zimbabwe and Zambia
On December 30, 2022, gauges on the ground measured a record-low water level at Lake Kariba, the world’s largest reservoir and a major source of hydroelectric power for two African countries. See the before-and-after images and get a Google Timelapse look at the changes.
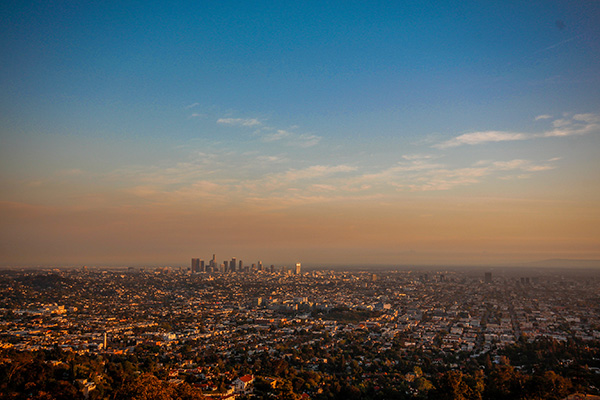
Images of Change: Snowy Southern California
A late-February storm blanketed parts of Southern California in snow, including much of the San Gabriel Mountains north of Los Angeles. Find out which low-elevation area also got covered.
|