|
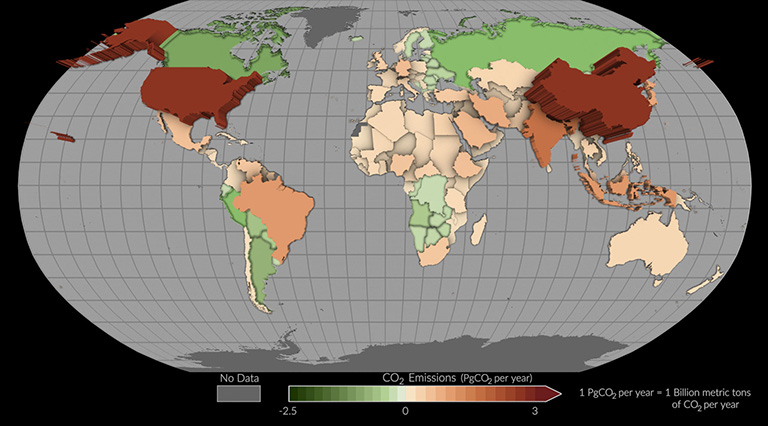
Update: Carbon Dioxide Concentration
February's global average atmospheric carbon dioxide (CO2) was about 419 parts per million (ppm), a roughly 50% increase since 1750. This rise is mainly due to human activities such as burning fossil fuels.
NASA Releases Agency Climate Strategy
From space, air, and on the ground, NASA studies Earth and the ways it is changing. These observations help us better understand – and prepare for – the effects of human-caused global warming. Today, the agency released its 2023 climate strategy.
Explore Time-Lapse Views of Our Changing Planet
NASA’s Images of Change gallery has added a new feature: "Google Timelapse" view. In addition to comparison views of before-and-after images, you can now view selected scenes as time-lapse sequences generated via the Google Earth engine.
Joint NASA, CNES Water-Tracking Satellite Reveals First Stunning Views
The Surface Water and Ocean Topography mission offers the first taste of the detailed perspectives of Earth’s surface water that its cutting-edge instruments will be able to capture.
NASA-Funded Scientists Estimate Carbon Stored in African Dryland Trees
NASA scientists have mapped almost 10 billion individual trees in Africa’s drylands to assess the amount of carbon stored outside of the continent’s dense tropical forests.
Twitter Thread: New IPCC Climate Report
The latest U.N. report is out, and while time is of the essence, the report offers hope. Visit the Twitter thread to learn more.
Twitter Thread: Monthly Temperature Update
February 2023 was the fourth-warmest February globally since modern recordkeeping began in 1880, measuring at 0.97°C (1.75°F) above the 1951-1980 baseline average. Eight of the 10 warmest Februarys have been in the last decade.
Need Spanish Climate Content?
Newly translated background articles, Earth vital signs, FAQs, and multimedia are available for your learning and teaching needs.
Update: Climate Time Machine
This popular interactive has two new climate key indicators: polar ice sheet melt and ocean warming. View the visualizations at the link above.
|