News | August 25, 2013
Sea ice this year unlikely to break records, but continues downward trend
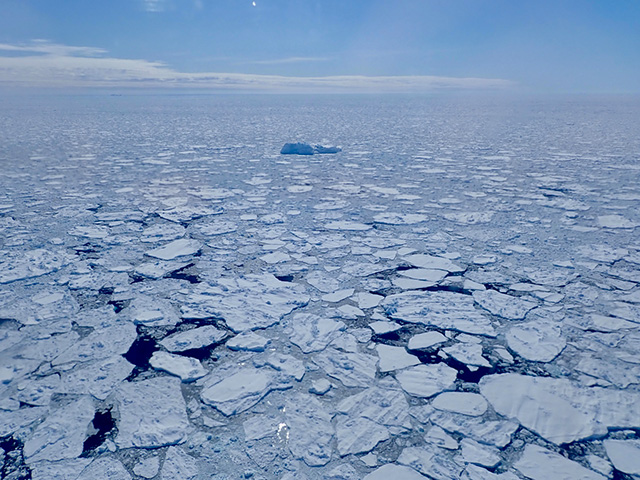
The melting of sea ice in the Arctic is well on its way toward its annual "minimum," that time when the floating ice cap covers less of the Arctic Ocean than at any other period during the year. While the ice will continue to shrink until around mid-September, it is unlikely that this year’s summer low will break a new record. Still, this year’s melt rates are in line with the sustained decline of the Arctic ice cover observed by NASA and other satellites over the last several decades.
“Even if this year ends up being the sixth- or seventh-lowest extent, what matters is that the 10 lowest extents recorded have happened during the last 10 years,” said Walt Meier, a glaciologist with NASA’s Goddard Space Flight Center in Greenbelt, Md. “The long-term trend is strongly downward.”
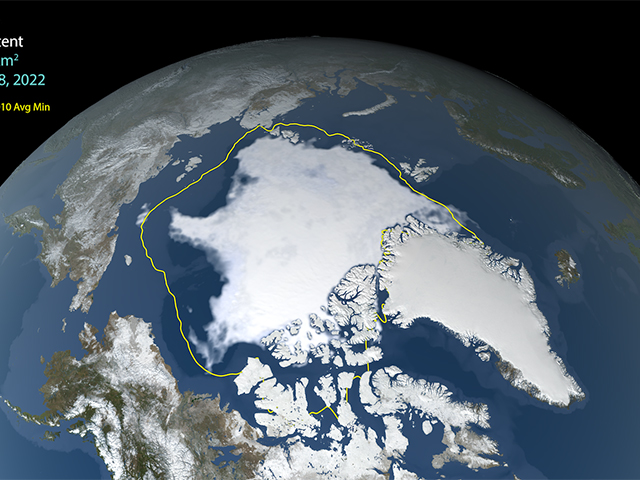
The icy cover of the Arctic Ocean was measured at 2.25 million square miles (5.83 million square kilometers) on Aug. 21. For comparison, the smallest Arctic sea ice extent on record for this date, recorded in 2012, was 1.67 million square miles (4.34 million square kilometers), and the largest recorded for this date was in 1996, when ice covered 3.16 millions square miles (8.2 million square kilometers) of the Arctic Ocean.
› Download HD formats from NASA Goddard's Scientific Visualization Studio
Watching the summertime dynamics of the Arctic ice cap has gained considerable attention in recent years as the size of the minimum extent has been diminishing – rapidly. On Sept.16, 2012, Arctic sea ice reached its smallest extent ever recorded by satellites at 1.32 million square miles (3.41 million square kilometers). That is about half the size of the average extent from 1979 to 2010.
Sea ice extent is a measurement of the area of the Arctic Ocean where ice covers at least 15 percent of the ocean surface. For additional information about the evolution of the sea ice cover, scientists also study the sea ice "area," which discards regions of open water among ice floes and only takes into account the parts of the Arctic Ocean completely covered by ice. On Aug. 21, 2013, the Arctic sea ice area was 1.98 million square miles (5.12 million square kilometers).
This year’s melting season included a fast retreat of the sea ice during the first half of July. But low atmospheric pressures and clouds over the central Arctic kept temperatures up north cooler than average, slowing down the plunge.
With about three weeks of melting left, the summer minimum in 2013 is unlikely to be a record low, said Joey Comiso, senior scientist at Goddard and coordinating lead author of the Cryosphere Observations chapter of the upcoming report of the Intergovernmental Panel on Climate Change.
“But average temperatures in the Arctic fluctuate from one week to another, and the occurrence of a powerful storm in August, as happened in 2012, could cause the current rate of decline to change significantly,” Comiso said.
This year, the Arctic has witnessed a few summer storms, but none of them as intense as the cyclone that took place in August 2012.
“Last year’s storm went across an area of open water and mixed the smaller pieces of ice with the relatively warm water, so it melted very rapidly,” Meier said. “This year, the storms hit in an area of more consolidated ice. The storms this year were more typical summer storms; last year’s was the unusual one.”
The Arctic sea ice cap has significantly thinned over the past decade and is now very vulnerable to melt, Comiso said. The multiyear ice cover, consisting of thicker sea ice that has survived at least two summers, has declined at an even faster rate than younger, thinner ice.
Meier said that a thinner, seasonal ice cover might behave more erratically in the summer than multiyear ice.
“First-year ice has a thickness that is borderline: It can melt or not depending on how warm the summer temperatures are, the prevailing winds, etcetera,” Meier said. “This year’s conditions weren’t super-favorable for losing ice throughout spring and summer; last year they were. Whereas with multiyear ice, it takes unusual warm conditions to melt it, which is what we’ve seen in the most recent years.”
On the opposite side of the planet, Antarctic sea ice, which is in the midst of its yearly growing cycle, is heading toward the largest extent on record, having reached 7.45 million square miles (19.3 million square kilometers) on Aug. 21. In 2012, the extent of Antarctic sea ice for the same date was 7.08 million square miles (18.33 million square kilometers). The phenomenon, which appears counter-intuitive but reflects the differences in environment and climate between the Arctic and Antarctica, is currently the subject of many research studies. Still, the rate at which the Arctic is losing sea ice surpasses the speed at which Antarctic sea ice is expanding.
The sea ice minimum extent analysis produced at Goddard – one of many satellite-based scientific analyses of sea ice cover – is compiled from passive microwave data from NASA's Nimbus-7 satellite, which operated from late October 1978 to August 1987, and the U.S. Department of Defense's Defense Meteorological Satellite Program, which has been used to extend the Nimbus 7 sea ice record onwards from August 1987. The record, which began in November 1978, shows an overall downward trend of 14.1 percent per decade in the size of the minimum summer extent, a decline that accelerated after 2007.
Related Link
› Arctic sea ice multimedia resources from NASA Goddard's Scientific Visualization Studio


