News | April 15, 2012
New salt in an ancient sea
Credit: NASA/Landsat/K. Lewis
By Aries Keck,
NASA Goddard Space Flight Center
The expansion of massive salt evaporation projects on the Dead Sea are clearly visible in this time series of images taken by Landsat satellites operated by NASA and the U.S. Geological Survey.
The Dead Sea is so named because its natural salinity discourages the growth of fish, plants and other wildlife. The sea exists because the land has been sinking for millennia due to the continents of Africa and Asia pulling away from each other. This depression makes the lake the lowest surface feature on Earth at about 1,300 feet (nearly 400 meters) below sea level. On a hot dry summer day, the surface of the Dead Sea can drop as much as one inch (two to three centimeters) because of evaporation.
The sea has attracted visitors for thousands of years. Between 1947 and 1956, a series of 972 ancient texts were discovered in caverns near the sea's northeastern shore. These Dead Sea Scrolls were written on papyrus and paper and contained details from the Hebrew Bible and other biblical documents.
The ancient Egyptians also used salts from the Dead Sea for mummification, fertilizers and potash (a potassium-based salt). In the modern age, the sodium chloride and potassium salts culled from the sea are also used in part for water conditioning, road de-icing and by the chemical industry for the manufacturing of polyvinyl chloride (PVC) plastics.
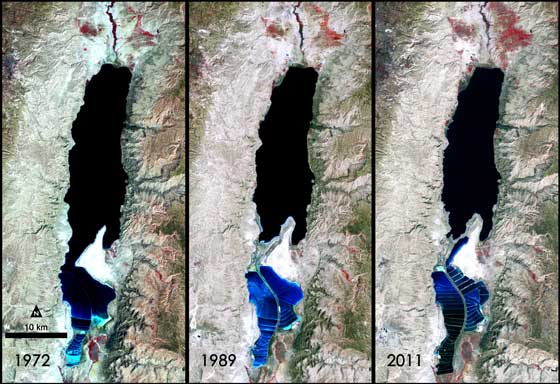
The Landsat 1, 4 and 7 satellites captured this false-color image using light from near-infrared, red and green wavelengths (MSS bands 4, 2, & 1 and TM and ETM+ bands 4, 3, & 2 respectively).
Landsat 1 launched in 1972 and provided scientific data until 1978. In 1982 NASA launched Landsat 4, which ran for 11 years until 1993. Landsat 7 is still up and running; it was launched in 1999. The data from these and other Landsat satellites has been instrumental in increasing our understanding of forest health, storm damage, agricultural trends, urban growth, and many other ongoing changes to our land.
NASA and the U.S. Department of the Interior through the U.S. Geological Survey (USGS) jointly manage Landsat, and the USGS preserves a 40-year archive of Landsat images that is freely available data over the Internet. The next Landsat satellite, now known as the Landsat Data Continuity Mission (LDCM) and later to be called Landsat 8, is scheduled for launch in January 2013.
Related Links