Lee esta historia en español aquí.
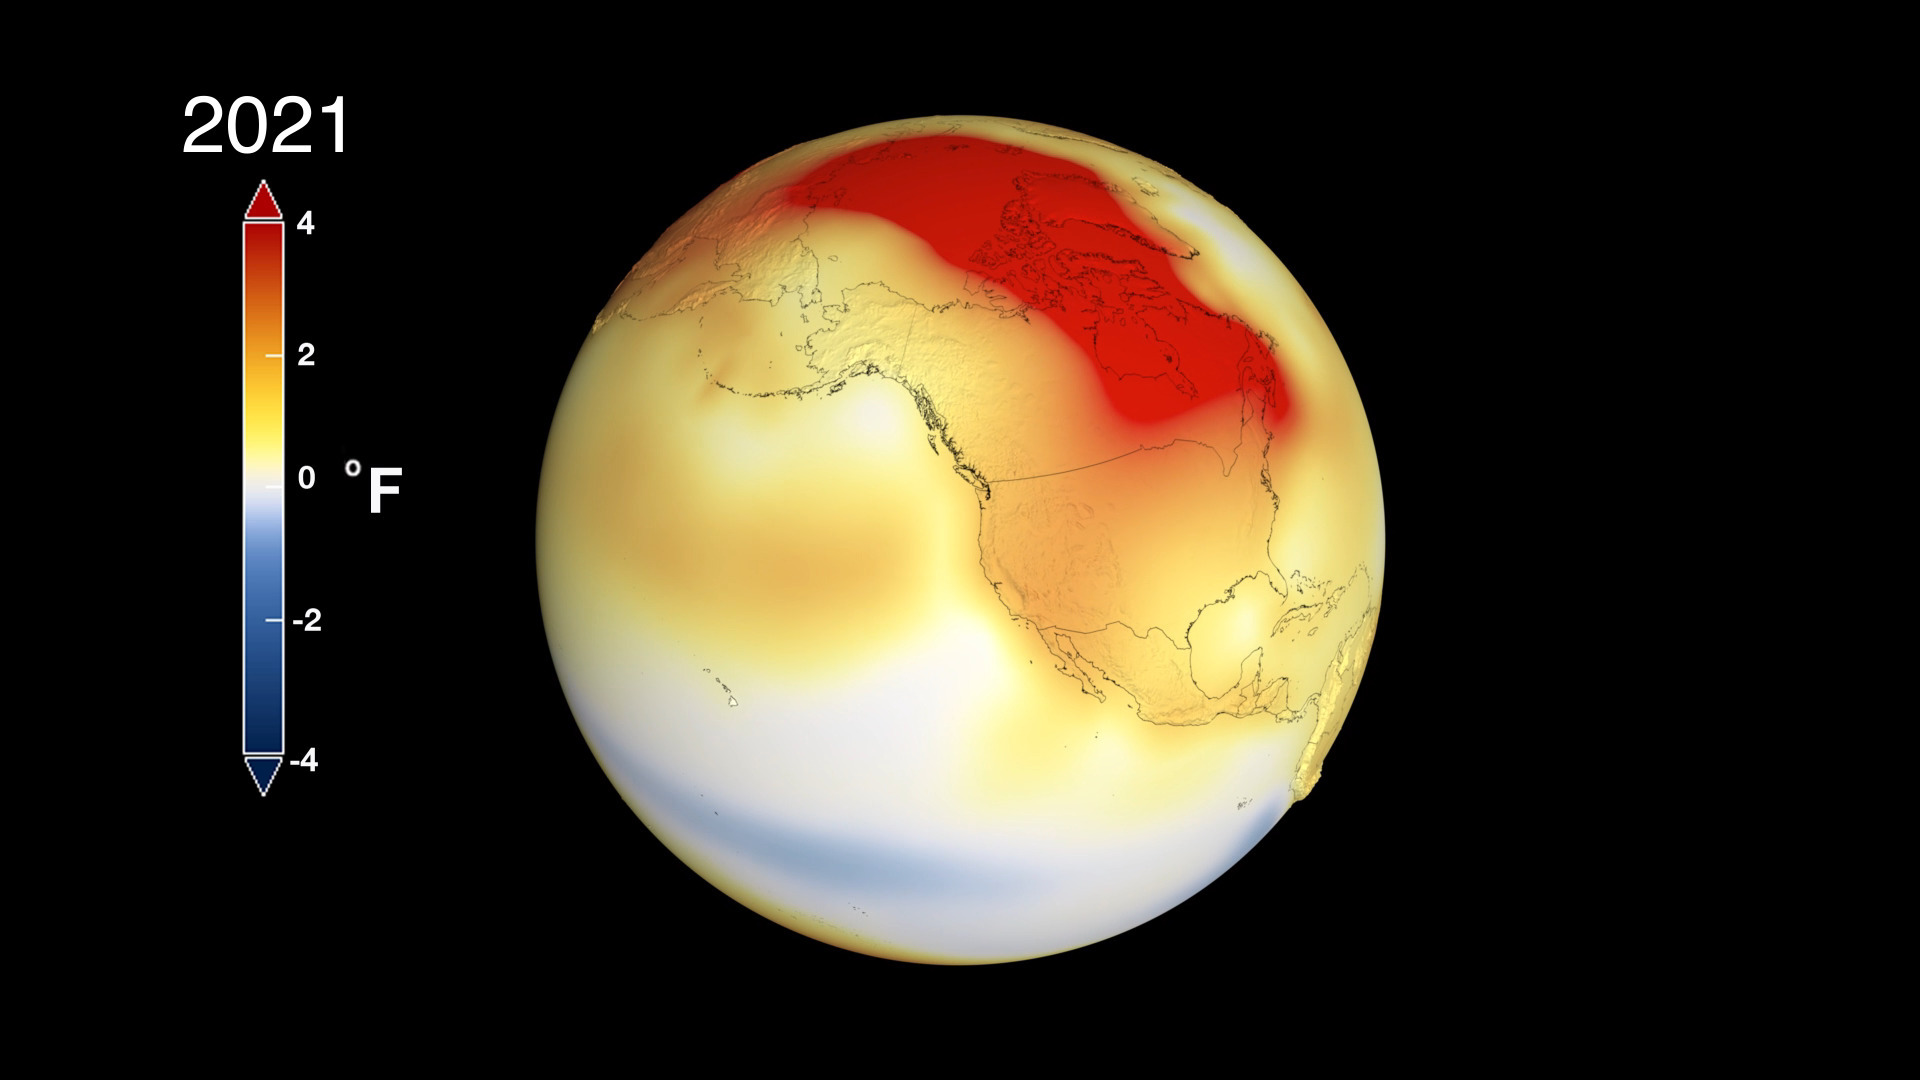
The year 2021 tied with 2018 as the sixth warmest year on a record that extends back to 1880, according to NASA’s annual analysis of global average temperatures. The year contributed to an unprecedented, but well-understood trend in which the last eight years have been the warmest ever recorded.
Scientists at NASA’s Goddard Institute for Space Studies (GISS) in New York City produce this record using data from instruments all over the world, which is validated by satellite data. Scientists update the record every year, maintaining one of the world’s most important datasets to study the extent, pace and causes of warming on our home planet.
Here, we answer six questions to help you understand the GISS global surface temperature analysis, what it shows about 2021 and how NASA makes sense of the data.

1. What is the GISS Global Surface Temperature Analysis?
Also known as GISTEMP, this product is one of several independent datasets by major scientific organizations that track Earth’s temperatures. Its publicly available raw data come from tens of thousands of instruments on weather stations, ships and ocean buoys, and Antarctic research stations.
The NASA analysis takes into account the seasonal cycle and average climate in each of these locations to determine how much warmer or cooler it is on average. Temperatures at different locations on Earth can vary by as much as 100 degrees Fahrenheit (55 degrees Celsius), but the average global temperature over the course of the year changes much more subtly. In other words, when scientists pull all that data together to estimate global average temperatures, the analysis serves as a massive, planetary thermometer.
2. If the record shows unprecedented warming, why isn’t every year the warmest year ever?
Earth’s temperature varies every year because of the many interactions among the land, air and ocean. These complex connections influence weather and temperatures regionally and globally.
One of these interactions is the El Niño-Southern Oscillation, a natural phenomenon in which heat transfers for several months between the Pacific and the atmosphere lead to temperature and rainfall fluctuations all over the world. La Niña, the cooler phase of this phenomenon, generally leads to weather patterns that lower Earth’s average temperature with a slight lag of several months. That’s how a La Niña event in early 2021 led to a cooler year than it would have been otherwise, in particular cooler than 2020 or 2016 — the warmest years on record.
Scientists are predicting that because La Niña reappeared in late 2021, its cooling influence will likely affect temperatures in 2022. Still, even with these phenomena, 2021 contributes to, and is consistent with, the observed long-term warming trend. Global temperatures are rising at a pace that the planet has not experienced in millennia, according to NASA. That is, even though short-term weather cycles can affect any single year, the warming trends are still very clear and growing.
3. How does NASA crunch the numbers to analyze global temperatures?
NASA’s analysis averages temperature estimates made over many decades. That produces a trend, or pattern, of how fast Earth’s surface temperatures have changed in recent times. The analysis uses a fixed period of 1951 to 1980 that serves as a baseline to compare how global temperatures today are deviating from what was normal then.
The baseline period included the best available data when scientists designed the basic methods for NASA’s analysis in the 1980s. These data also included comprehensive global coverage, since datasets from pre-1950 generally excluded input from the Southern Hemisphere.
The steps to calculate temperature anomalies today remain fundamentally the same as they did in the 1980s. A key exception is that refined algorithms now minimize errors resulting from data in urban areas, which tend to warm more than rural areas. The amount and quality of data available also has increased substantially over time, improving how much of Earth’s surface the dataset covers.
4. How reliable is NASA’s temperature analysis?

Scientists always try to confirm the accuracy of the record with independent studies and, in recent decades, satellites. Recent assessments revealed the agency's estimates of the annual average are accurate to within a tenth of a degree Fahrenheit.
The record uses raw data stretching back to 1880, when methods to measure temperature were less developed. But these historic data still provide a very useful window into the past. The recent assessments show that even when factoring in greater uncertainties in data from before 1950, they still provide the basis for a good estimate of past global annual temperatures. In other words, the pre-1950 data are like a blurry photo compared to the sharpness of today's datasets: Scientists are a little more uncertain about some of its details but can still be certain about the overall picture the data show.
NASA also checks for irregularities in the quality and distribution of data, as faulty instruments, human errors in recording and processing data and other non-climatic factors can yield unrealistic readings. When raw data from individual stations seems inaccurate, scientists double-check them manually by comparing these data against neighboring areas with similar climatic conditions. These adjustments can influence records at individual stations and small regions, but they barely change global averages.
Other organizations also process the same data with slightly different methods. Their records all show trends remarkably similar to NASA’s analysis.
5. What are some indicators and consequences of warming?
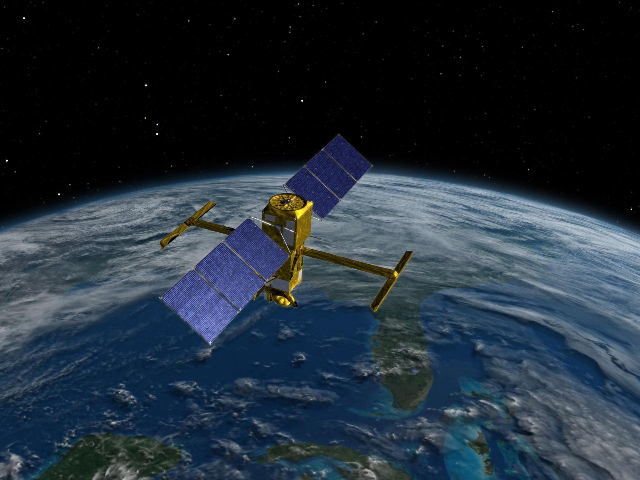
Satellite data confirm how warming on the land, air and ocean is affecting different parts of the planet. The rising temperatures are causing ice sheets and glaciers worldwide to melt, heatwaves to be longer and more intense, and plants and animal habitats to shift as they respond to warming.
As NASA’s temperature analysis shows the Arctic is warming four times faster than the rest of the planet, satellites show a decline in the region’s sea ice extent of about 13% per decade. Satellites also show the ocean is warming at an unprecedented rate, with 2021 marking the hottest ocean temperatures and the highest global sea levels ever recorded.
In 2021, Earth saw several extreme examples of how excess heat in the ocean and atmosphere can influence often devastating, sometimes unexpected, disasters in different parts of the world. Australia, Europe and Asia experienced historic floods driven by record-breaking levels of intense rainfall. In the United States, the record-setting Dixie Fire burned in California, massive heat-waves were seen in the Pacific Northwest and Hurricane Ida caused damages from Louisiana to New York.
6. Why does NASA estimate global surface temperature change?
In the early 1970s, research into Venus’ atmosphere provided a stark example of how extremely high amounts of greenhouse gasses, which trap heat in the atmosphere, turned Earth’s so-called twin into an uninhabitable world with blistering surface temperatures that would melt lead.
Scientists then became increasingly concerned about the influence of carbon dioxide and other greenhouse gasses on Earth. In 1981, NASA scientists were the first to estimate global temperature averages using the techniques that eventually evolved into the current analysis. The idea was to provide context for predictions of future climate change.
Today, the analysis has helped explain how carbon dioxide emissions, deforestation and other human activities are driving global warming — and why volcanic eruptions, fluctuations in the Sun’s energy output and other natural factors are not the primary drivers of the observed warming trend.


