News | July 20, 2021
NASA Study Finds Tropical Forests' Ability to Absorb Carbon Dioxide Is Waning
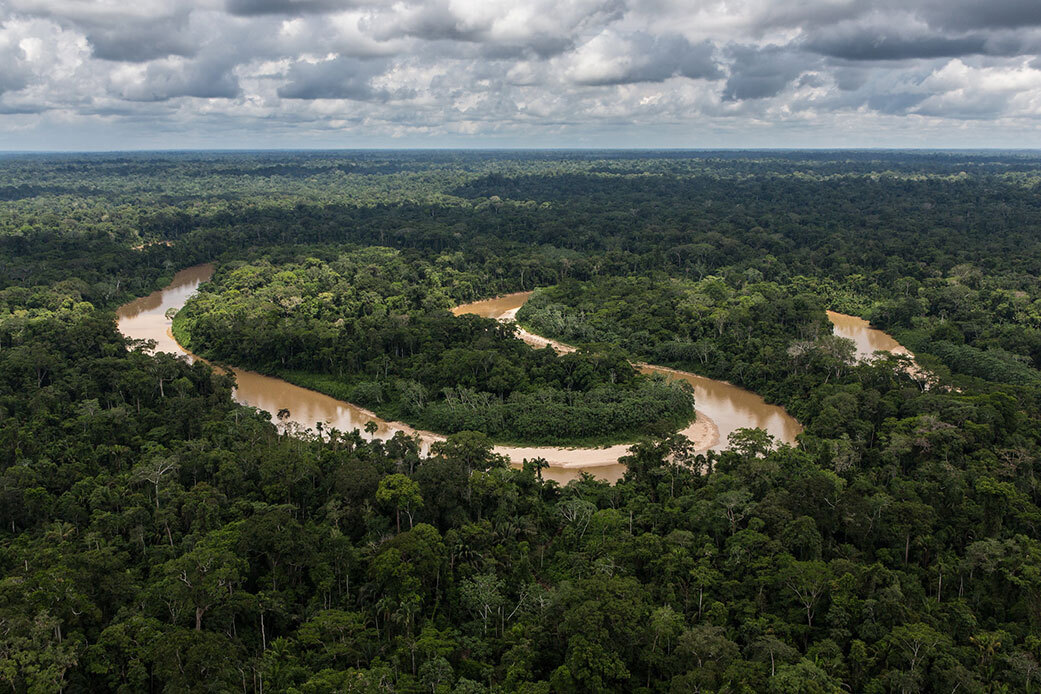
The Amazon rainforest is often called “the lungs of the world.” It produces oxygen and stores billions of tons of carbon every year. The Amazon rainforest covers more than 60% of the landmass of Peru. Credit: USDA Forest Service photo by Diego Perez
Earth’s trees and plants pull vast amounts of carbon dioxide out of the atmosphere during photosynthesis, incorporating some of that carbon into structures like wood. Areas that absorb more carbon than they emit are called carbon sinks. But plants can also emit the greenhouse gas during processes like respiration, when dead plants decay, or during combustion in the case of fires. Researchers are particularly interested in whether – and how – plants at the scale of an ecosystem like a forest act as sources or sinks in an increasingly warming world.
A recent study led by scientists at NASA’s Jet Propulsion Laboratory in Southern California identified whether vegetated areas like forests and savannas around the world were carbon sources or sinks every year from 2000 to 2019. The research found that over the course of those two decades, living woody plants were responsible for more than 80% of the sources and sinks on land, with soil, leaf litter, and decaying organic matter making up the rest. But they also saw that vegetation retained a far smaller fraction of the carbon than the scientists originally thought.
In addition, the researchers found that the total amount of carbon emitted and absorbed in the tropics was four times larger than in temperate regions and boreal areas (the northernmost forests) combined, but that the ability of tropical forests to absorb massive amounts of carbon has waned in recent years. The decline in this ability is because of large-scale deforestation, habitat degradation, and climate change effects, like more frequent droughts and fires. In fact, the study, published in Science Advances, showed that 90% of the carbon that forests around the world absorb from the atmosphere is offset by the amount of carbon released by such disturbances as deforestation and droughts.
Get NASA's Climate Change News: Subscribe to the Newsletter »
The scientists created maps of carbon sources and sinks from land-use changes like deforestation, habitat degradation, and forest planting, as well as forest growth. They did so by analyzing data on global vegetation collected from space using instruments such as NASA’s Geoscience Laser Altimeter System (GLAS) on board ICESat and the agency’s Moderate Resolution Imaging Spectroradiometer (MODIS) aboard the Terra and Aqua satellites, respectively. The analysis used a machine-learning algorithm that the researchers first trained using vegetation data gathered on the ground and in the air using laser-scanning instruments.
Taking Stock
“A lot of research that has come before hasn’t been spatially explicit – we haven’t had a map of where carbon fluxes were occurring,” said Nancy Harris, research director of the forest program at the World Resources Institute in Washington and one of the study authors.
Other ways of estimating how much carbon is exchanged between vegetated areas and the atmosphere include looking at how many plants or forests are in a particular region and studying land-use changes, combining that information with carbon emission estimates. But those methods have spatial or temporal limitations that the study authors tried to address with their machine-learning method.
Knowing where plants are taking up carbon and where they’re emitting it is important for monitoring how forests and other vegetated regions respond to a changing climate. “The Amazon was considered a substantial carbon sink because of large tracts of pristine forest that soak up carbon dioxide,” said Sassan Saatchi, principal scientist at JPL and the study lead investigator. “However, our results show that overall, the Amazon Basin is becoming almost neutral in terms of carbon balance because deforestation, degradation, and the impacts of warming, frequent droughts, and fires over the past two decades release carbon dioxide to the atmosphere.”
Saatchi and his colleagues developed their analysis so that it’s easier to track changes in vegetated areas based on data collected on the ground as well as remotely. “Our approach is designed to make sure we can systematically balance the global carbon budget every year, and that countries can use the results and methodology for carbon management and their own reporting needs,” he said.

This budgeting analysis helped the researchers better understand the dynamics of how forests and other vegetated areas around the world were storing the carbon that they’re absorbing from the atmosphere. “Many previous studies found that vegetation around the world absorbs a lot of atmospheric carbon dioxide,” said study lead author Alan Xu, a carbon researcher at JPL and UCLA. “It gives the impression that global forests are growing and getting bigger everywhere, but that’s not the case.”
Missing Pieces
This study helps to fill in the picture of where and how trees and plants are absorbing or emitting carbon, but there’s more work to be done. The satellite-based carbon maps in this study covered about 39 square miles (100 square kilometers) at a time, but they couldn’t necessarily pick up changes happening on smaller scales. And there was some information about how forests stored and emitted carbon within those maps that wasn’t necessarily accounted for in the researchers’ source-sink calculations. Some of these information gaps should be remedied by higher-resolution carbon maps provided by newer satellites already in orbit, as well as upcoming missions like the NASA-Indian Space Research Organization’s NISAR.
It’s important to understand how regions around the world absorb and emit carbon dioxide, said Harris. “If we’re not getting these patterns right, we may be missing some of these ecosystems and how they’re affecting the carbon cycle.” But she is encouraged by the sheer amount of data becoming available to climate scientists on how the greenhouse gas moves between the atmosphere and Earth’s forests, grasslands, and other vegetated areas.
Saatchi is hopeful that having a more systematic and consistent approach to keeping track of which parts of the world are acting as carbon sources or sinks will enable better monitoring across regions and countries. “It could allow countries around the world to use the data as guidance for meeting their national commitments to the Paris Climate Agreement.”
Learn more about climate change and carbon dioxide here:
https://climate.nasa.gov/vital-signs/carbon-dioxide/
News Media Contacts
Jane J. Lee / Ian J. O’Neill
Jet Propulsion Laboratory, Pasadena, Calif.
818-354-0307 / 818-354-2649
jane.j.lee@jpl.nasa.gov / ian.j.oneill@jpl.nasa.gov


