Ask your average resident of California, Oregon, or Washington to name the natural hazard that concerns them most and sea level rise probably won’t bubble to the top of the list. After all, the region is better known for its wildfires, earthquakes, heat waves, and mudslides.
But those who live along the coastline know better. They’ve seen first-hand the effects of coastal erosion, beach loss, storm damage, and tidal flooding resulting from sea level rise. In some locations, it’s a constant battle to hold back the sea. Yet during the 1990s and 2000s, natural climate cycles actually suppressed the rate of sea level rise off the U.S. West Coast.
That lull appears to be over. Changing Pacific Ocean and atmospheric conditions have stirred up Earth’s largest ocean and redistributed its heat, piling up warm waters along U.S. western shores and raising sea level in the process.
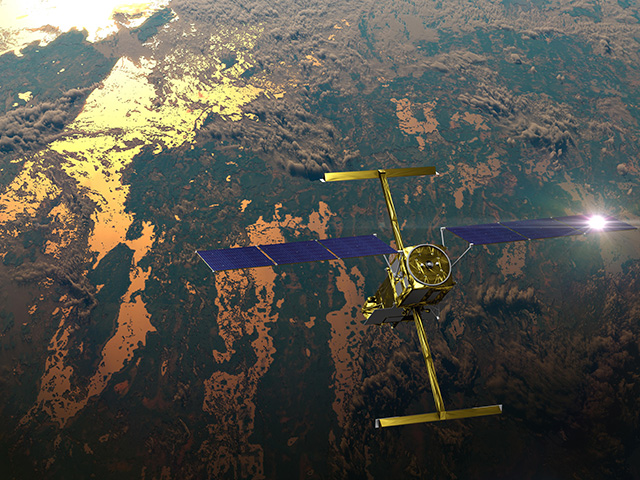
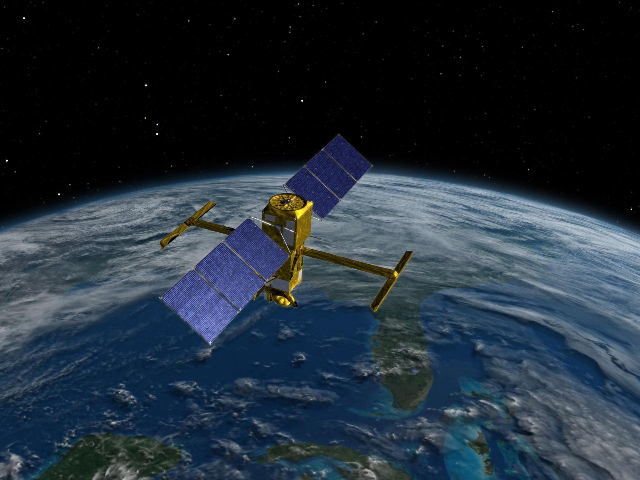
Global sea level has risen an average of 0.13 inches (3.3 millimeters) a year since satellites began precisely measuring sea surface height following the 1992 launch of the Topex/Poseidon mission, a partnership between NASA and Centre National D’Etudes Spatiales in France. In the northeastern Pacific off the U.S. West Coast, however, sea level actually fell at a rate of around 0.04 inches (1 millimeter) per year during the 1990s and 2000s.
Then around 2010, sea level along the U.S. West Coast began steadily increasing, with the largest rise occurring in 2014-2016. While the rate has stabilized since then, it remains higher than the global average.
Get NASA's Climate Change News: Subscribe to the Newsletter »
Ben Hamlington is a NASA Jet Propulsion Laboratory scientist working with a group of researchers to study how U.S. West Coast sea level may change in the next couple of decades. The researchers are studying data from satellites and tide gauges to help understand the difference between sea level changes caused by rising global temperatures and those due to naturally occurring cyclic processes, particularly the impacts of two natural climate cycles that link conditions in the Pacific Ocean with the atmosphere above: The El Niño-Southern Oscillation (ENSO) and the Pacific Decadal Oscillation (PDO). What his team has seen is concerning.

“Based on available observations, we appear to be in an elevated period of sea level rise along the U.S. West Coast,” said Hamlington, who leads NASA’s Sea Level Change Science Team. “We’ve seen an increase of about 0.4 inches (10 millimeters) a year for the past five years and, based on available past observations and modeled data, we expect to see similar increases for the next few years. Based on historical data, there are indications that elevated sea level rise rates could persist much longer. We could see 20 years of elevated rates.”
What’s going on, and will it continue? To understand West Coast sea level variations, it helps to get a big picture of ENSO and the PDO and how they influence regional sea levels.
ENSO, the PDO, and Their Influences

Seen from space, changing Pacific sea surface heights reveal a seesaw-like pattern in the western and eastern tropical Pacific. When sea level is higher than average in the western Pacific, as it was during the first half of the satellite altimeter record, it’s lower than average on the eastern side, and vice versa. This phenomenon is driven on shorter timescales by ENSO and the PDO.
ENSO is a recurring pattern of interactions between the ocean and atmosphere that affects ocean temperatures in the central and eastern Pacific Ocean, influencing sea level, global climate and weather patterns. It’s best known for its opposing phases: El Niño and La Niña. During El Niño, westward-blowing trade winds in the western tropical Pacific along the equator weaken, allowing warm waters to move east toward the Americas. During La Niña, these trade winds are stronger than normal, and cold water that usually sits along the South American coast is pushed to the central Pacific. These events happen every few years and persist for six to 18 months. El Niños can increase West Coast sea level by more than 7.9 inches (20 centimeters) over this time period, while La Niñas can decrease it by a similar amount.
Both El Niño and La Niña play on a larger stage that operates on decade-long timescales. The PDO is a long-term pattern of change that alternates between warm and cool phases about every five to 20 years. In the PDO’s cool phase, warm water forms a horseshoe-shaped pattern connecting the north, west and south Pacific, with a pool of cool water in the middle that extends up the U.S. West Coast. In its warm phase, these warm and cool regions are reversed, and warm water occupies the pool in the middle and along the West Coast.
Shifts in the PDO phase have significant impacts on global climate and weather, affecting Pacific and Atlantic hurricane activity, droughts and flooding around the Pacific basin, marine ecosystems, global land temperature patterns, and Pacific basin sea level variations.
For West Coast communities threatened by rising seas, predicting when the seesaw will swing the other way is critical.
“People have been lulled into a false sense of security because we’ve seen very little sea level rise along the West Coast in recent decades,” said Hamlington. “Persistent cool PDO phases have suppressed sea level, locally masking the long-term rise due to global warming from human activities. Around 2010, the PDO began a shift from a cool to a warm phase and sea level is now increasing. As global sea level rises, the impacts of these natural climate swings are going to get worse.”

Oceanographer William Sweet of the National Oceanic and Atmospheric Administration’s (NOAA) National Ocean Service in Silver Spring, Maryland, believes El Niño will drive impacts on the West Coast in the near term. “Cycling into the warm phase of the PDO tends to increase the frequency and severity of El Niños, resulting in higher sea level during high tides,” he said. “El Niño events are really glimpses into the future, because decades of sea level rise can occur within one year, at least based on historical measurements.”
Hamlington’s team is combining satellite and tide gauge data with model projections of sea level change to assess past, present and future trends and determine the processes behind them. “We have tide gauge data going back to the early 20th century, even as far as 1854 for San Francisco,” he said. “When we look at the data, we see periods of elevated sea level rates caused by combined ENSO events and PDO shifts.”
Widely Varying Impacts
Hamlington said if the current sea level rise trend continues, we’ll likely see increased coastal erosion and high tide flooding, with impacts varying widely by location.
Portions of the West Coast are fronted by sea cliffs made of sedimentary rock that erodes easily. Storm-generated waves collapse these coastal bluffs and cause coastlines to retreat, threatening vulnerable properties perched near the edge of sea cliffs and infrastructure like rail lines and highways. Runoff from land areas and prolonged winter rains compound the problem. A recent study by the U.S. Geological Survey found that the current rates of coastal erosion could double due to sea level rise by the end of this century.
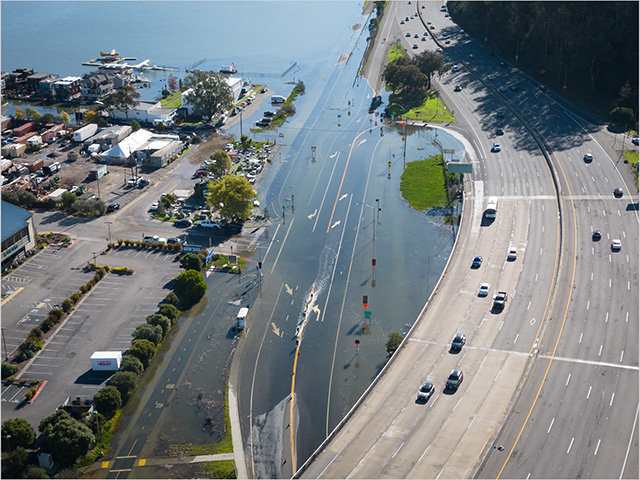
Perhaps the biggest wild card is high tide flooding. While the West Coast has largely been spared from these “sunny day” or “nuisance” floods, Sweet says these types of events are likely to occur more frequently in the future, with sea level rise, PDO variations and vertical land motion (sinking or rising of coastal lands) adding to the effect at certain times and places.
Many coastal locations have a known threshold: a safety gap between regular high tide water levels and flooding conditions. Coastal communities are built a certain elevation above sea level with these natural fluctuations in mind. In many West Coast cities first built around the turn of the 20th century, safety gaps are now being exceeded due to the combination of long-term increases in sea level and these same natural fluctuations. A PDO shift can remove an additional 3.9 inches (10 centimeters) from the remaining safety gap, increasing flooding potential.

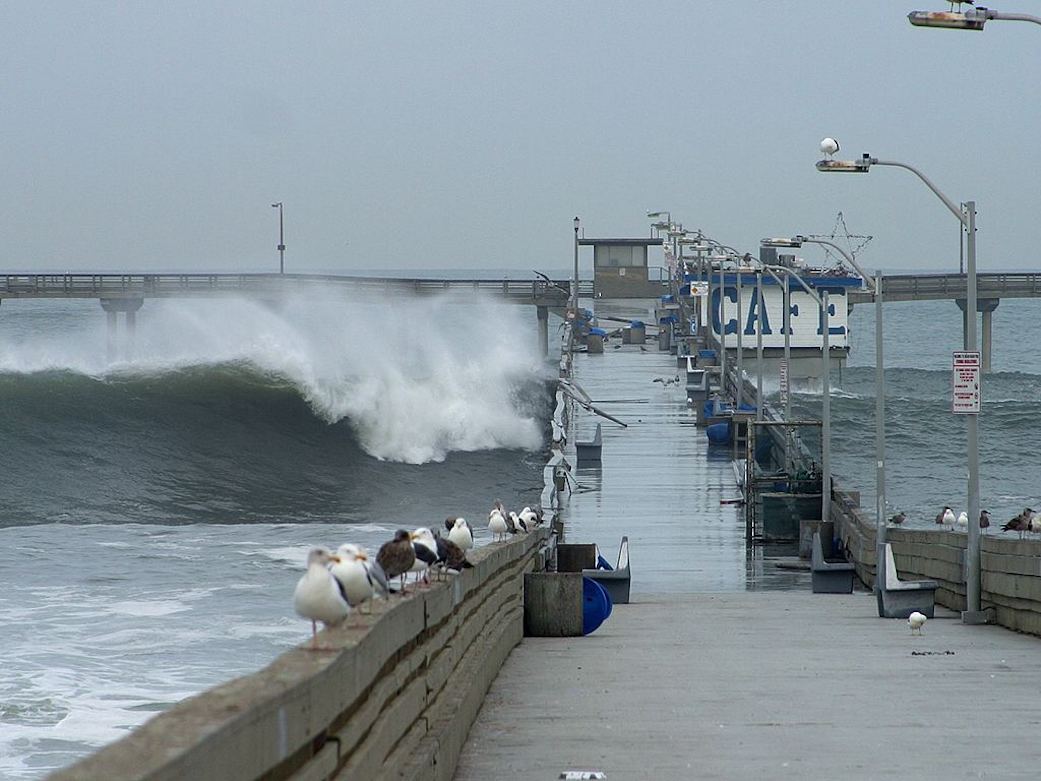
Sweet said the type of flooding that currently impacts the West Coast most frequently is wave-related. This is best noticed during king tides. These tides, which are associated with the position of the Sun and Moon and are unrelated to climate change, bring an additional 200 to 300 millimeters (8 to 12 inches) of water. King tides provide a preview of what a foot of sea level rise will bring permanently to a shoreline.
Sweet said it’s hard to envision sunny day flooding in California because it’s mostly flooding related to rough seas and breaking waves that people experience. As sea level continues to rise due to human activities and combines with El Niño events, at some point that water rise is going to become noticeable and problematic in areas that don’t experience breaking waves.
Climate scientist Dan Cayan of Scripps Institution of Oceanography at UC San Diego, agrees. “Over time, nuisance flooding episodes have been increasing along the Southern California coast,” he said. “If sea level starts to increase at the mean global rate or higher, we’re going to see increasing flooding under relatively mild storms and during regular high tide situations. That’s going to be something to watch out for over the next decade, as it would be an enormous acceleration of what we’ve seen historically.”
Cayan said enhanced sea level rise in San Diego would have the greatest impact when accompanied by a winter storm, and would be most pronounced if that storm happened during a spring tide. “In 1983 when we had a large El Niño, we had two cases where storms coincided with high tides. During that winter there were a lot of real estate losses along our coast, including Scripps Pier, which dates to 1914.”

Read more
Effects of Vertical Land Motion
Another factor that will impact rising West Coast sea levels is vertical land movement – sinking or rising of coastal lands. In areas where land is sinking, sea level rises to a given flooding threshold level earlier.
“It’s important to consider the impacts of vertical land motion when assessing coastal flooding threats,” Hamlington said. “Thanks to GPS data, we have long records of West Coast vertical land motion and they show some pretty high rates of subsidence (sinking) and considerable variability. La Jolla and San Diego have subsidence on the order of 0.08 inches (2 millimeters) per year since the 1990s. In San Francisco, it’s about 0.04 inches (1 millimeter) a year. This subsidence will add to and combine with the natural and human-caused increases we see from the ocean, making the impacts of sea level rise worse.”
The Future
Looking at the rest of this century, Hamlington said based on past observations and modeled projections of future changes, he expects West Coast sea level to continue its long-term increase, with significantly elevated and suppressed rates at different times due to natural year-to-year and decade-scale variations. A wild card is the future contribution to sea level rise from the Antarctic ice sheet, which, if melted, could lead to West Coast sea level rise greater than the global average.
“It’s critical that planners account for the full range of substantial natural sea level variations in order to make informed planning decisions,” he said. “West Coast sea level variations due to the PDO and ENSO can lead to extended periods of elevated flood risk that compound the impacts from global sea level rise due to human-induced climate warming. It’s critical that we understand the processes that drive these variations and their magnitude.”

