Why are there so many songs about rainbows? For NASA’s upcoming Plankton, Aerosol, Cloud, ocean Ecosystem mission, or PACE, the colors of the rainbow — or, if you prefer, the visible wavelengths of the electromagnetic spectrum — are the key to unlocking a wealth of new data on skies and seas around the world.
PACE’s high-resolution instruments will see ocean and atmosphere features in unparalleled detail when the mission launches in 2023. By measuring the intensity of the color that exits Earth’s ocean surface, PACE will capture fine details about phytoplankton — tiny plantlike organisms and algae that live in the ocean — that are the basis of the marine food web and generate half of Earth’s oxygen. Beneficial phytoplankton communities fuel fisheries, but harmful algal blooms (HABs) can poison animals and humans and disrupt tourism and fishing industries.
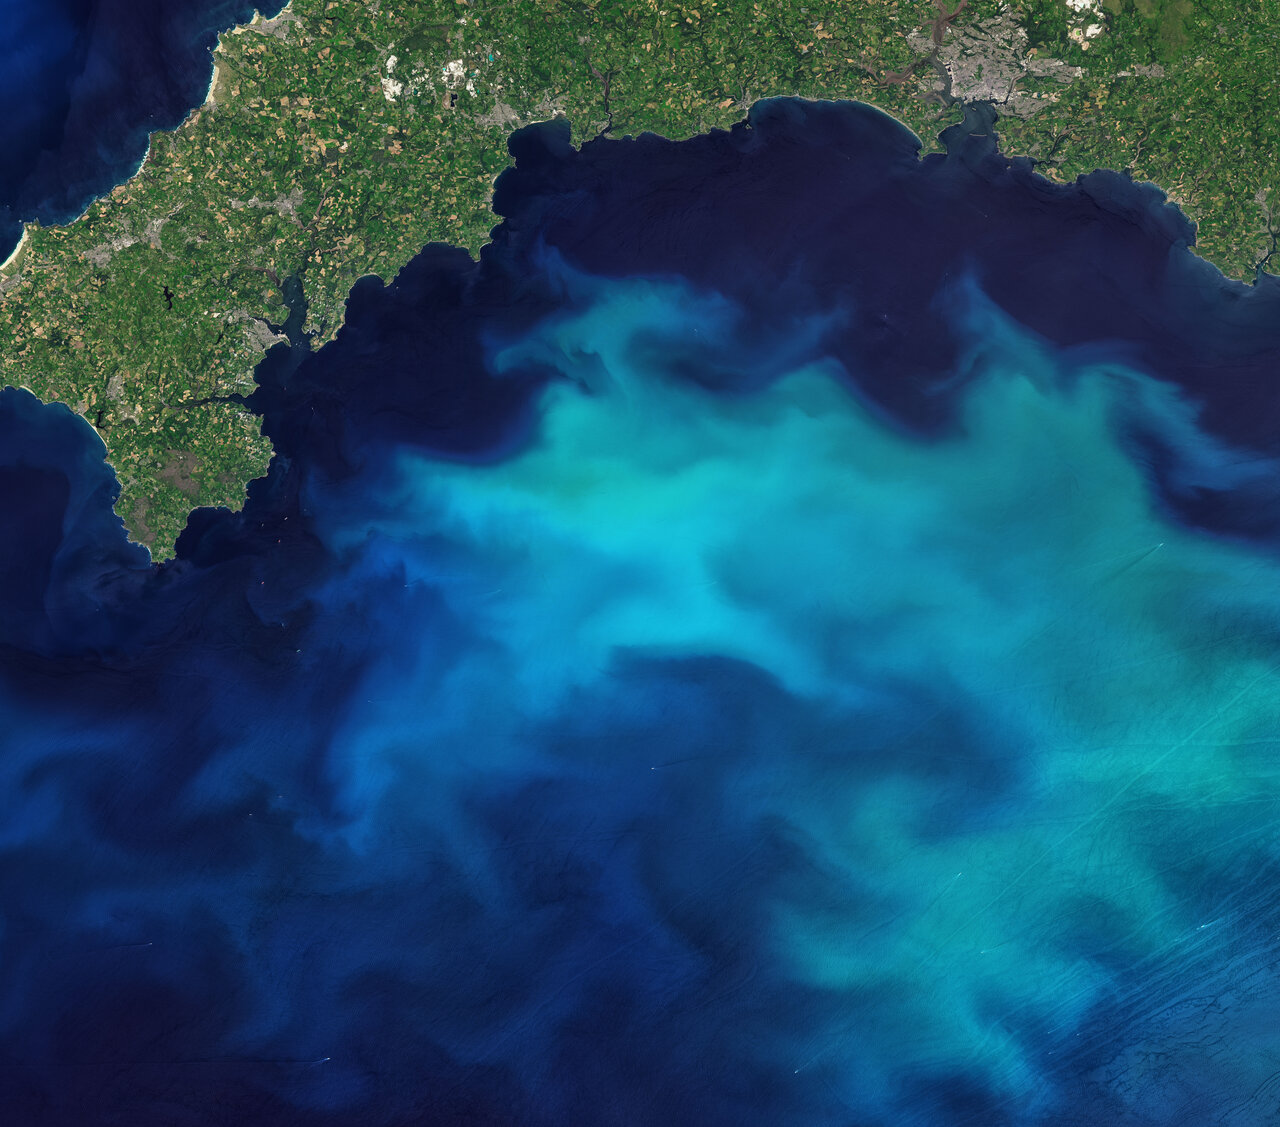
When it comes to “ocean color,” both the wavelength and intensity of the colors leaving the ocean are important. Different species of phytoplankton and other substances in a body of water absorb and reflect different colors of light: clear open ocean water appears blue, water with lots of phytoplankton often appears green or turquoise, and water near the coast looks brown due to suspended sediments and dissolved organic material. PACE can see small variations in these visible color differences in far more detail than ever before.
As PACE spots all the colors of the rainbow over the ocean and atmosphere, it will provide scientists with new discoveries at every wavelength.
When the global COVID-19 pandemic forced social distancing among the development teams, the challenge was how to keep making progress on this extremely important research initiative, even though most engineers and others involved with the mission's development could not actually work together in fabrication areas.
It turns out that the extraordinary team bring PACE to life were not about to give up their goals, and in this video we hear from a range of NASA pros talk about how to keep going, keep standards high, and see their plans through even the most challenging of circumstances. Credit: NASA / Michael Starobin
Ultraviolet and Violet
Ultraviolet wavelengths (which are invisible to the human eye) and violet wavelengths (which are visible) help scientists learn about aerosols: particles in the atmosphere that may be organic or inorganic, solid or liquid, ranging from dust and soot to sea salt and chemical droplets. These wavelengths help reveal whether measured aerosols are natural or come from human activities.
Ultraviolet and violet wavelengths will also help scientists study particles dissolved in the ocean — specifically, to distinguish between chlorophyll (a green pigment found in all phytoplankton) and other organic materials. Knowing the difference is important for studying how much carbon sinks and gets stored in the deep ocean.
“Not all plankton do the same thing when it comes to carbon,” said Ivona Cetinić, an oceanographer at NASA’s Goddard Space Flight Center (GSFC) and PACE’s project science lead for biogeochemistry. “Some are better producers, some are better sequesterers who draw carbon dioxide down. Once the carbon enters the plankton, what happens later on depends on the type of plankton. If it’s teeny-tiny, there’s a big chance it will get eaten by a zooplankton – they are teeny-tiny cows, no? – which will get eaten by a bigger one, and so on. If those reactions happen close to the surface, the carbon comes back to the atmosphere. If the zooplankton poops, the carbon goes down into the deep ocean.”
Blue
Blue wavelengths help researchers differentiate between phytoplankton species. From diatoms to dinoflagellates, each phytoplankton species has its own identity: Different functions within the ecosystem, different nutritional needs (and content, for predators!), and importantly for the Ocean Color Instrument (OCI), different wavelengths of light that they absorb and scatter. Colors in the blue range of the spectrum will allow scientists to see the composition of phytoplankton communities.
“If you’re looking at a meadow, it all looks green to your eyes, but you want to know all the players in that ecosystem,” said Cetinić. “It’s rare that you get just one type of plankton in a community; it’s much more likely that they’ll work together. They make up a microbial food web. PACE will allow us to resolve, not just one or two species, but the whole community.”
Tracking phytoplankton community composition and health is not only important for understanding the ocean now, but also for predicting how it could change in the future.
Green
Green wavelengths are often used as a reference for the total amount of particles in the air. These are combined with shorter and longer wavelengths to further determine the size of these particles. Size is an important factor in helping scientists know at what they are looking. Natural aerosols like dust or sea salt tend to have larger particles than human-produced ones like soot or smoke, so particle size helps identify aerosols’ sources.
“There are several reasons it’s important to better understand aerosols,” said Andrew Sayer, an atmospheric scientist at NASA GSFC and PACE’s project science lead for atmospheres. “One reason is more useful air quality forecasts. Another is linked to climate: the cooling or warming effect aerosols have on climate, the way they interact with clouds and affect cloud lifetime, is dependent on the vertical distribution of all these features. We’ll be better able to monitor this from space. Satellite data can be used to interrogate the climate models more thoroughly and improve them.”
Similarly, different phytoplankton species are different sizes, so this variable helps identify who is who in a plankton community.
Yellow and Orange
The OCI’s yellow and orange wavelengths help scientists track phytoplankton health and physiology. Scientists can determine how healthy a phytoplankton community is by looking at how quickly the phytoplankton are growing, how efficient their photosynthesis is and what color they are – all information they can gather with yellow and orange wavelengths.
Understanding phytoplankton health can help predict harmful algal blooms, or HABs. When substances from land wash into the ocean, they sometimes become a feast for algae, allowing them to eat, grow and multiply rapidly. HABs can generate harmful toxins that sicken marine wildlife and humans and deplete oxygen in the water as bacteria feed on numerous dead algae.
“Harmful algal blooms are not recent. We have writings from indigenous tribes in the Pacific Northwest that talk about things happening on the beach,” said Cetinić. “It’s just that today we’re looking for it more, and also anthropogenic influences are making blooms more prevalent.”
While naturally occurring minerals can run into the ocean and feed algae, chemicals produced by humans – lawn fertilizer, wastewater treatment chemicals and agricultural chemicals, for example – are a much greater culprit.
“When any ecosystem is in balance, it’s never static. One thing is dominant, then it rolls over,” said Cetinić. “But when an ecosystem is pushed out of its rhythm, one thing becomes dominant. During a harmful algal bloom, just one species has the capability to grow really fast, and it takes over.”
Red and Near-Infrared
Red and near-infrared wavelengths give the team a look into a different portion of the ocean: Coastal areas, with waters fed by rivers and shallower bottoms with sediments that can be suspended after a storm, are often colored very differently than the open ocean. Variations in the colors reflected back from coastal areas not only give scientists clues to the health of the organisms that live there, which also helps them prepare for coastal HABs, but also inform on outflows from riverine systems and watershed dynamics.
“With PACE, we can see the early developmental stages of blooms and say what species it is,” said Cetinić. Early warnings allow businesses in coastal areas to prepare for HAB impacts, such as not harvesting or selling fish that consume the toxic algae, preparing veterinary offices for an influx of sick animals, aerating the water to prevent bottom-dwelling creatures from suffering lack of oxygen, and warning consumers not to eat sardines or oysters, she added.
“Many of these kinds of early warning systems and measures are already in place in these coastal areas, so we’ll be adding our data to their systems,” Cetinić said. “Early information always saves money for local economies.”
Short-Wave Infrared
Just outside the range of visible light are the short-wave infrared (SWIR) wavelengths, which have a number of uses for both the atmosphere and the ocean.
SWIR wavelengths help scientists determine how clear the atmosphere is over the ocean, which is important for calculations of ocean properties at the surface. It also helps with similar calculations for the atmosphere over the coast, which helps with studies of clouds and coastal biology.
“Clouds reflect sunlight, they trap heat and light,” Sayer said. “We need a very accurate understanding of their brightness and physical location.”
By also monitoring how much sunlight gets blocked by aerosols, the OCI will help scientists resolve an important gap in modeling, said Sayer. Clouds and aerosols interact with each other in the atmosphere, but scientists need more information about how and where.
“There are some seasonally repeating aerosol features where you often get aerosols above the clouds,” he said. “For example, in the southeast Atlantic, there’s a lot of agricultural biomass burning in central and southern Africa, which peaks in August to October. A lot of that blows off over the ocean, where there’s a low-lying cloud deck. It’s similar in southeast Asia. These aerosols make it harder to accurately determine cloud properties.”
In the same way, clouds make it harder to study aerosols, he said.
“If you’re a climate modeler trying to model the transport of aerosols around the world, there are large areas of the world where you’re getting limited amounts of useful data,” he explained. “With the OCI, having more spectral bands will really help fill some of those gaps. Having a hyperspectral instrument that goes into the ultraviolet range will make it much easier to quantify these aerosols, especially in combination with the polarimeters.”

