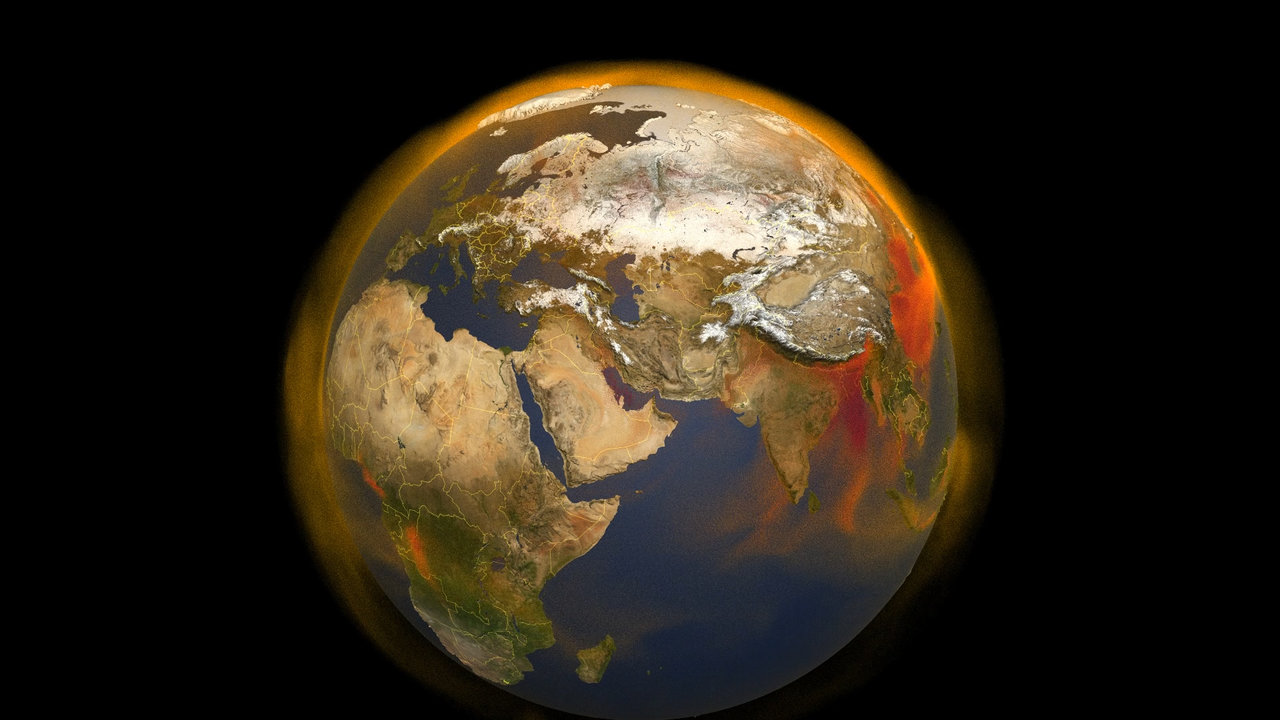
NASA’s new 3-dimensional portrait of methane concentrations shows the world’s second largest contributor to greenhouse warming, the diversity of sources on the ground, and the behavior of the gas as it moves through the atmosphere. Combining multiple data sets from emissions inventories, including fossil fuel, agricultural, biomass burning and biofuels, and simulations of wetland sources into a high-resolution computer model, researchers now have an additional tool for understanding this complex gas and its role in Earth’s carbon cycle, atmospheric composition, and climate system.
Since the Industrial Revolution, methane concentrations in the atmosphere have more than doubled. After carbon dioxide, methane is the second most influential greenhouse gas, responsible for 20 to 30% of Earth’s rising temperatures to date.
“There’s an urgency in understanding where the sources are coming from so that we can be better prepared to mitigate methane emissions where there are opportunities to do so,” said research scientist Ben Poulter at NASA’s Goddard Space Flight Center in Greenbelt, Maryland.
A single molecule of methane is more efficient at trapping heat than a molecule of carbon dioxide, but because the lifetime of methane in the atmosphere is shorter and carbon dioxide concentrations are much higher, carbon dioxide still remains the main contributor to climate change. Methane also has many more sources than carbon dioxide, which include the energy and agricultural sectors, as well as natural sources from various types of wetlands and water bodies.
“Methane is a gas that’s produced under anaerobic conditions, so that means when there’s no oxygen available, you’ll likely find methane being produced,” said Poulter. In addition to fossil fuel activities, primarily from the coal, oil and gas sectors, sources of methane also include the ocean, flooded soils in vegetated wetlands along rivers and lakes, agriculture, such as rice cultivation, and the stomachs of ruminant livestock, including cattle.
“It is estimated that up to 60% of the current methane flux from land to the atmosphere is the result of human activities,” said Abhishek Chatterjee, a carbon cycle scientist with Universities Space Research Association based at Goddard. “Similar to carbon dioxide, human activity over long time periods is increasing atmospheric methane concentrations faster than the removal from natural ‘sinks’ can offset it. As human populations continue to grow, changes in energy use, agriculture and rice cultivation, livestock raising will influence methane emissions. However, it’s difficult to predict future trends due to both lack of measurements and incomplete understanding of the carbon-climate feedbacks.”
Researchers are using computer models to try to build a more complete picture of methane, said research meteorologist Lesley Ott with the Global Modeling and Assimilation Office at Goddard. “We have pieces that tell us about the emissions, we have pieces that tell us something about the atmospheric concentrations, and the models are basically the missing piece tying all that together and helping us understand where the methane is coming from and where it’s going.”
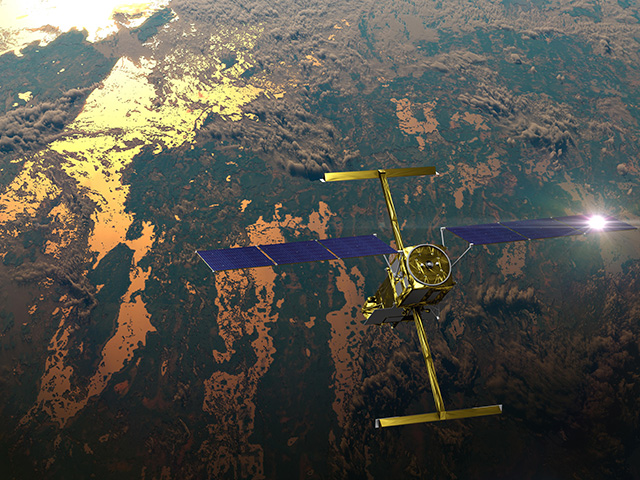
To create a global picture of methane, Ott, Chatterjee, Poulter and their colleagues used methane data from emissions inventories reported by countries, NASA field campaigns, like the Arctic Boreal Vulnerability Experiment (ABoVE) and observations from the Japanese Space Agency’s Greenhouse Gases Observing Satellite (GOSAT Ibuki) and the Tropospheric Monitoring Instrument aboard the European Space Agency’s Sentinel-5P satellite. They combined the data sets with a computer model that estimates methane emissions based on known processes for certain land-cover types, such as wetlands. The model also simulates the atmospheric chemistry that breaks down methane and removes it from the air. Then they used a weather model to see how methane traveled and behaved over time while in the atmosphere.
The data visualization of their results shows methane’s ethereal movements and illuminates its complexities both in space over various landscapes and with the seasons. Once methane emissions are lofted up into the atmosphere, high-altitude winds can transport it far beyond their sources.
When they first saw the data visualized, several locations stood out.
In South America, the Amazon River basin and its adjacent wetlands flood seasonally, creating an oxygen-deprived environment that is a significant source of methane. Globally, about 60% of methane emissions come from the tropics, so it’s important to understand the various human and natural sources, said Poulter.
Over Europe, the methane signal is not as strong as over the Amazon. European methane sources are influenced by the human population and the exploration and transport of oil, gas and coal from the energy sector.
In India, rice cultivation and livestock are the two driving sources of methane. “Agriculture is responsible for about 20% of global methane emissions and includes enteric fermentation, which is the processing of food in the guts of cattle, mainly, but also includes how we manage the waste products that come from livestock and other agricultural activities,” said Poulter.
China’s economic expansion and large population drive the high demand for oil, gas and coal exploration for industry as well as agriculture production, which are its underlying sources of methane.
The Arctic and high-latitude regions are responsible for about 20% of global methane emissions. “What happens in the Arctic, doesn’t always stay in the Arctic,” Ott said. “There’s a massive amount of carbon that’s stored in the northern high latitudes. One of the things scientists are really concerned about is whether or not, as the soils warm, more of that carbon could be released to the atmosphere. Right now, what you’re seeing in this visualization is not very strong pulses of methane, but we’re watching that very closely because we know that’s a place that is changing rapidly and that could change dramatically over time.”
“One of the challenges with understanding the global methane budget has been to reconcile the atmospheric perspective on where we think methane is being produced versus the bottom-up perspective, or how we use country-level reporting or land surface models to estimate methane emissions,” said Poulter. “The visualization that we have here can help us understand this top-down and bottom-up discrepancy and help us also reduce the uncertainties in our understanding of the global methane budget by giving us visual cues and a qualitative understanding of how methane moves around the atmosphere and where it’s produced.”
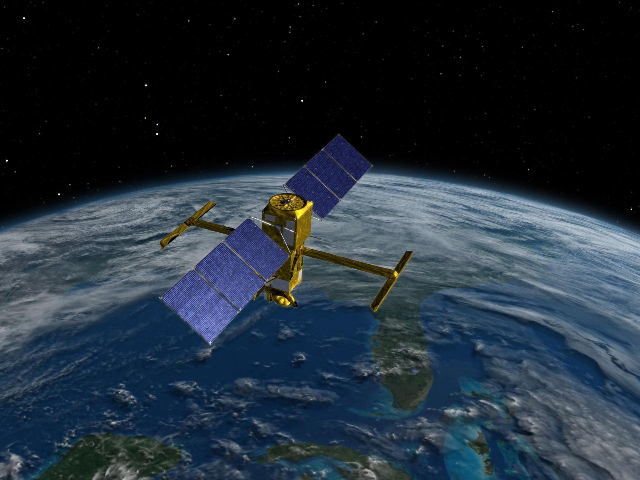
The model data of methane sources and transport will also help in the planning of both future field and satellite missions. Currently, NASA has a planned satellite called GeoCarb that will launch around 2023 to provide geostationary space-based observations of methane in the atmosphere over much of the western hemisphere.


