5 min read
Sizing Up Humanity's Impacts on Earth's Changing Atmosphere: A Five-Part Series
“I wouldn’t describe Earth’s atmosphere as fragile so much as I’d say our climate system is unstable,” said atmospheric scientist Eric Fetzer of NASA’s Jet Propulsion Laboratory in Pasadena, California. “Climate is being changed by the addition of greenhouse gases to the atmosphere.”
Fetzer said humanity has pushed climate instability well away from where it has been for many millennia. “We’ve had 8,000 years of pretty much the same climate, and only about a century where things have really started to change,” he says.
NASA Scientific Visualization Studio
Fetzer is project scientist for the Atmospheric Infrared Sounder (AIRS) instrument on NASA’s Aqua satellite. Launched in 2002, AIRS is one of six instruments aboard Aqua. At the time of its launch, AIRS was the most advanced atmospheric sounding system ever deployed in space, and it continues to make major contributions to our understanding of climate. During its 17 years in orbit, AIRS data have also improved operational weather forecasts around the world, and the instrument measures atmospheric temperature, water vapor and a number of trace gases, including carbon dioxide, ammonia, methane and carbon monoxide.
Fetzer highlighted a few of AIRS’ many scientific achievements.
“We found that Earth’s climate system has responded to increasing carbon dioxide concentrations as climate models predicted,” he said. “Atmospheric water vapor is sensitive to the presence of carbon dioxide. The more carbon dioxide, the more the atmosphere warms due to the greenhouse effect. A warmer atmosphere holds more water vapor, which is itself a greenhouse gas. This is how water vapor triples the warming from increasing carbon dioxide and other greenhouse gases.”
AIRS data have detected significant changes in the climate of the Arctic. “We see increases in Arctic water vapor levels,” he said. “The Arctic atmosphere is becoming more moist, adding to its warming, and the ocean is becoming more ice-free. These changes are happening more rapidly than scientists expected. I didn’t anticipate seeing them in a 17-year data record.”
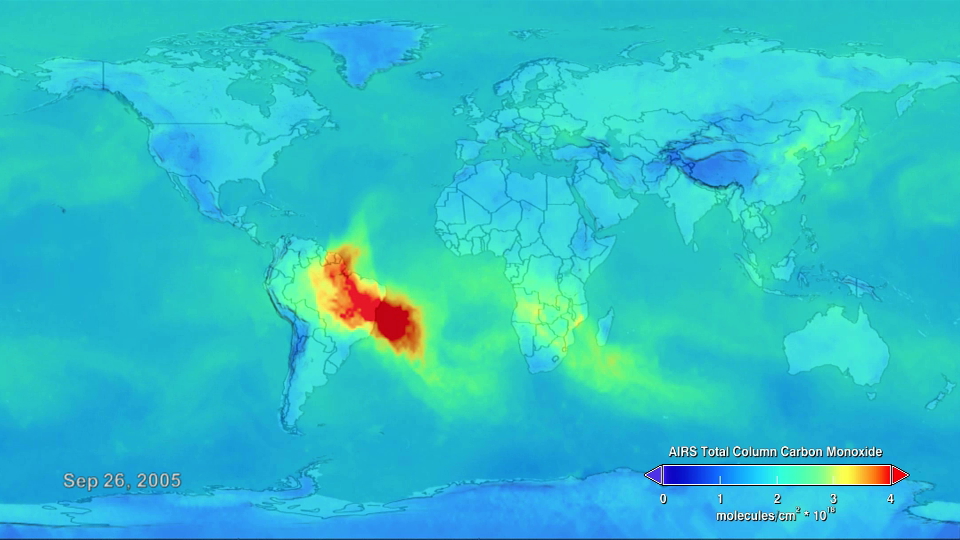
Fetzer said the AIRS team has also observed significant increases in the concentration of atmospheric ammonia in areas like northern India and eastern China due to agricultural activities. This has negatively impacted air quality in these regions.
Fetzer added that while greenhouse gases are arguably the biggest driver of global climate change, other chemicals such as carbon monoxide and ammonia are also changing significantly, and AIRS is tracking those changes.
NASA/GSFC Scientific Visualization Studio
While a replacement for AIRS was not specifically called out in the latest National Academy of Sciences’ Earth science decadal survey, which provides a roadmap for future Earth science satellite missions, Fetzer’s team is still planning for such a possibility.
“Most NASA instruments are typically one-of-a-kind, and there aren’t usually plans for replacements,” he said. “In the years since AIRS was developed, atmospheric sounding techniques have changed significantly. But while the technologies may be different, the nature of the measurement remains the same.”
In fact, says Fetzer, many of the instruments developed in recent years to measure the atmosphere derive heritage from AIRS. For example, techniques developed for use on AIRS have been applied to such missions as the Cross-track Infrared Sounder (CrIS) instrument on the NASA/NOAA Suomi National Polar-orbiting Partnership (NPP) satellite, NOAA’s Joint Polar Satellite System (JPSS)-1 satellite, and the Infrared Atmospheric Sounding Interferometer (IASI) instruments on the three polar-orbiting MetOp meteorological satellites developed by the European Space Agency and operated by the European Organization for the Exploitation of Meteorological Satellites (EUMETSAT).
“Even if an AIRS replacement is never built, AIRS has firmly cemented its place in atmospheric science history,” he said.
For more on AIRS, visit https://airs.jpl.nasa.gov/.
Part Four of this series: 'The Atmosphere: Fresh Insights on Air Quality, Ozone and Climate'

