Every evening from late spring to early fall, two planes lift off from airports in the western United States and fly through the sunset, each headed for an active wildfire, and then another, and another. From 10,000 feet above ground, the pilots can spot the glow of a fire, and occasionally the smoke enters the cabin, burning the eyes and throat.
The pilots fly a straight line over the flames, then U-turn and fly back in an adjacent but overlapping path, like they’re mowing a lawn. When fire activity is at its peak, it’s not uncommon for the crew to map 30 fires in one night. The resulting aerial view of the country’s most dangerous wildfires helps establish the edges of those fires and identify areas thick with flames, scattered fires and isolated hotspots.
A large global constellation of satellites, operated by NASA and National Oceanic and Atmospheric Administration (NOAA), combined with a small fleet of planes operated by the U.S. Forest Service (USFS) help detect and map the extent, spread and impact of forest fires. As technology has advanced, so has the value of remote sensing, the science of scanning the Earth from a distance using satellites and high-flying airplanes.
The most immediate, life-or-death decisions in fighting forest fires – sending smokejumpers to a ridge, for example, or calling an evacuation order when flames leap a river – are made by firefighters and chiefs in command centers and on the fire line. Data from satellites and aircraft provide situational awareness with a strategic, big-picture view.
“We use the satellites to inform decisions on where to stage assets across the country,” said Brad Quayle of the Forest Service’sGeospatial Technology and Applications Center, which plays a key role in providing remote-sensing data for active wildfire suppression. “When there’s high competition for firefighters, tankers and aircraft, decisions have to be made on how to distribute those assets.”
It’s not uncommon for an Earth-observing satellite to be the first to detect a wildfire, especially in remote regions like the Alaskan wilderness. And at the height of the fire season, when there are more fires than planes to map them, data from satellites are used to estimate the fire’s evolution, capturing burned areas, the changing perimeter and potential damage, like in the case of Montana’s Howe Ridge Fire, which burned for nearly two months in Glacier National Park last summer.
Global Fire Picture from Space
In January 1980, two scientists, Michael Matson and Jeff Dozier, who were working at NOAA’s National Environmental Satellite, Data, and Information Service building in Camp Springs, Maryland, detected tiny bright spots on a satellite image of the Persian Gulf. The image had been captured by the Advanced Very High Resolution Radiometer (AVHRR) instrument on the NOAA-6 satellite, and the spots, they discovered, were campfire-sized flares caused by the burning of methane in oil wells. It marked the first time that such a small fire had been seen from space. Dozier, who would become the founding dean of the Bren School of Environmental Science and Management at University of California at Santa Barbara, was “intrigued by the possibilities,” and he went on to develop, within a year, a mathematical method to distinguish small fires from other sources of heat. This method would become the foundation for nearly all subsequent satellite fire-detection algorithms.
What was learned from AVHRR informed the design of the first instrument with spectral bands explicitly designed to detect fires, NASA’s Moderate Resolution Imaging Spectroradiometer, or MODIS, launched on the Terra satellite in 1999, and a second MODIS instrument on Aqua in 2002. MODIS in turn informed the design of the Visible Infrared Imaging Radiometer Suite, VIIRS, which flies on the Joint Polar Satellite System’s NOAA/NASA Suomi-NPP and NOAA-20 satellites. Each new instrument represented a major step forward in fire detection technology.
“Without MODIS, we wouldn’t have the VIIRS algorithm,” said Ivan Csiszar, active fire product lead for the Joint Polar Satellite System calibration validation team. “We built on that heritage.”
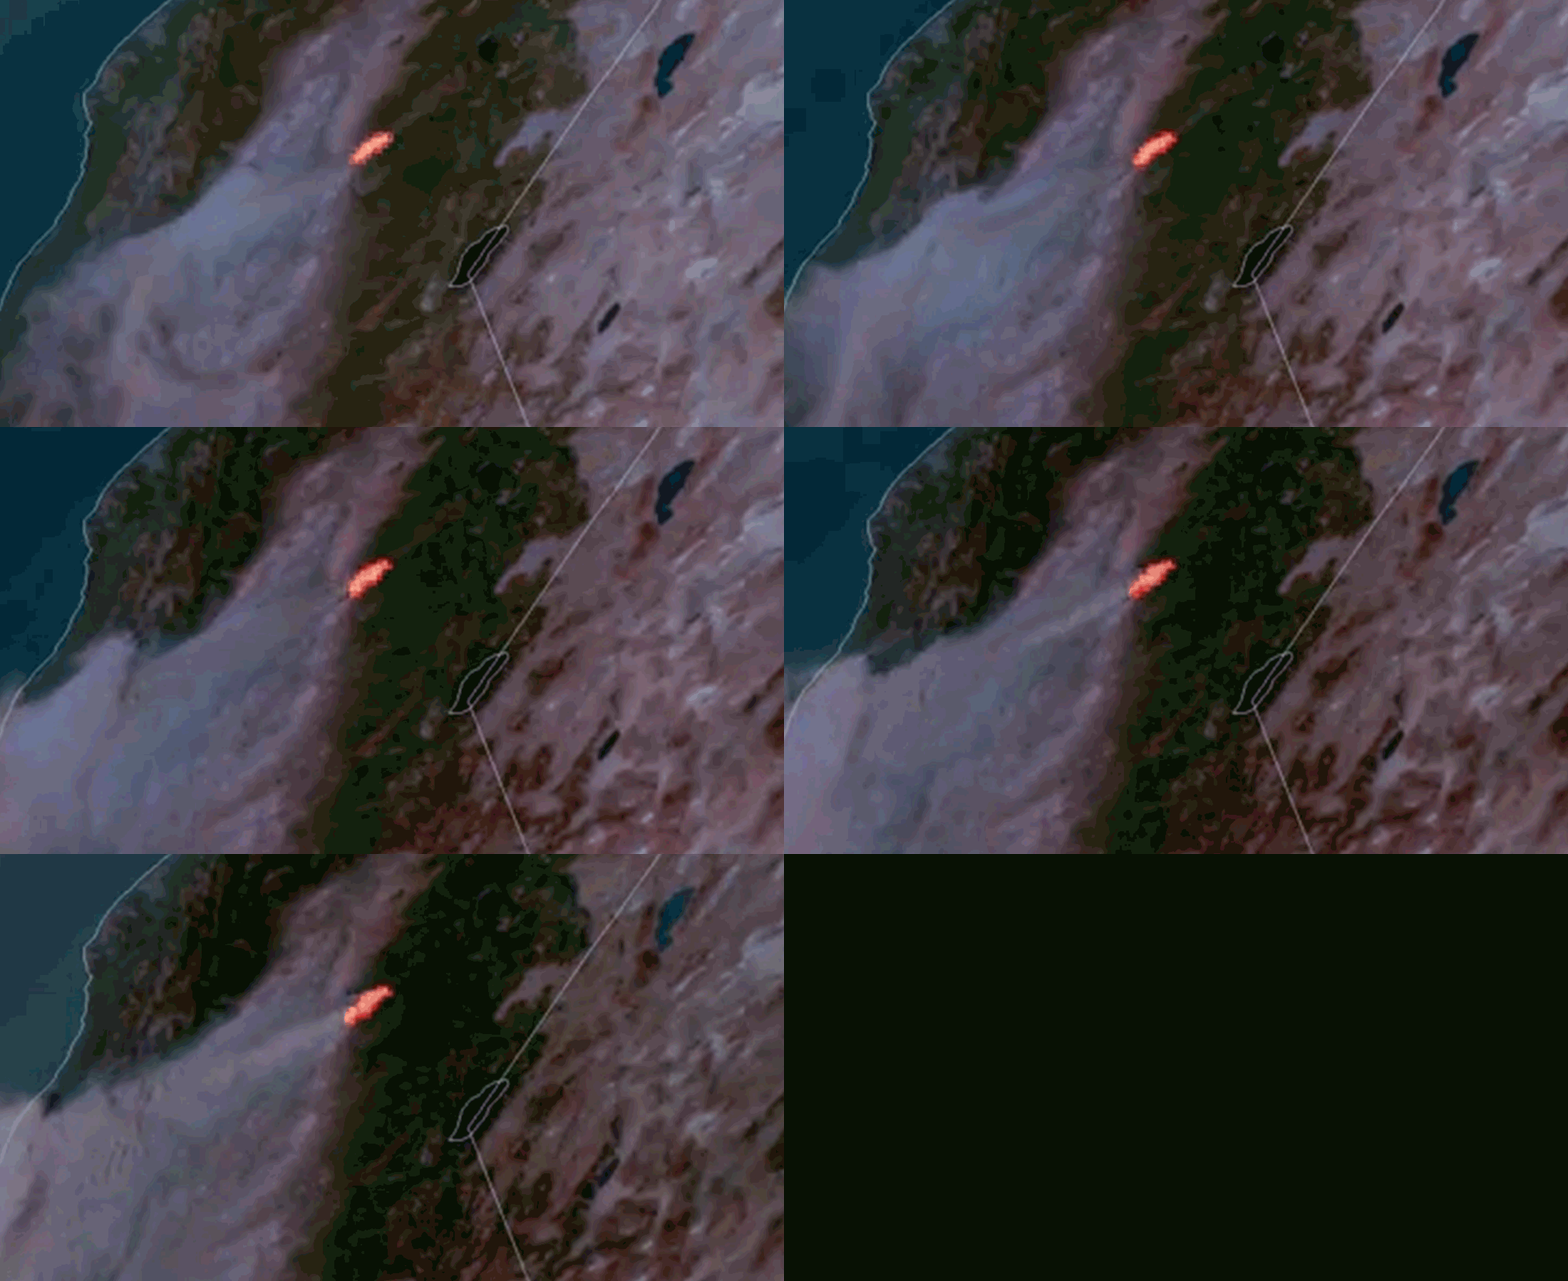
The instruments on polar-orbiting satellites, like Terra, Aqua, Suomi-NPP and NOAA-20, typically observe a wildfire at a given location a few times a day as they orbit the Earth from pole to pole. Meanwhile, NOAA’s GOES-16 and GOES-17 geostationary satellites, which launched in November 2016 and March 2018, respectively, provide continuous updates, though at a coarser resolution and for fixed portions of the planet.
“You can’t get a global picture with an aircraft, you can’t do it from a ground station,” said Ralph Kahn, a senior research scientist at NASA’s Goddard Space Flight Center. “To get a global picture, you need satellites.”
The MODIS instrument mapped fires and burn scars with an accuracy that far surpassed AVHRR. And after nearly 20 years in orbit, the optical and thermal bands on MODIS, which detect reflected and radiated energy, continue to provide daytime visible imagery and night-time information on active fires.
VIIRS has improved fire detection capabilities. Unlike MODIS, the VIIRS imager band has higher spatial resolution, at 375 meters per pixel, which allows it to detect smaller, lower temperature fires. VIIRS also provides nighttime fire detection capabilities through its Day-Night Band, which can measure low-intensity visible light emitted by small and fledgling fires.
The first moments after a fire ignites are critical, said Everett Hinkley, National Remote Sensing Program Manager for the U.S. Forest Service. In California, for example, when intense winds combine with dry fuel conditions, the response time can mean the difference between a catastrophic fire, like the Camp Fire that consumed nearly the entire town of Paradise, and one that is quickly contained.
“Those firefighters who are first responders don’t always know the precise location of the fire, how fast it’s moving or in what direction,” Hinkley said. “We’re working to try to give them real-time or near-real-time information to help them better understand the fire behavior in those early critical hours.”
Responders increasingly turn to the GOES satellites for early, precise geolocation of fires in remote areas. On July 2, 2018, for example, after smoke was reported in a wooded area near Central Colorado’s Custer County, GOES East detected a hotspot there. Forecasters in Pueblo visually inspected the data and provided the exact coordinates of what would become the Adobe Fire, and crews were sent quickly to the scene. The fire detection and characterization algorithm, the latest version of NOAA's operational fire detection algorithm, is in the process of being updated and is expected to further improve early fire detection and reduce false positives.
“The holy grail is that firefighters want to be able to get on a fire in the first few hours or even within the first hour so they can take action to put it out,” said Vince Ambrosia, a wildfires remote-sensing scientist at NASA’s Ames Research Center in Moffett Field, California. “So it’s critical to have regular and frequent coverage.”
Remote sensing data on wildfires is accessed in many different ways. Among them, NASA’s Fire Information for Resource Management System, or FIRMS, uses MODIS and VIIRS data to provide updates on active fires throughout the world, including a rough location of a detected hotspot. Imagery is available within four to five hours.
Smoke and Public Health
Of course, where there’s fire, there’s smoke, and knowing how wildfire smoke travels through the atmosphere is important for air quality, visibility and human health. Like other particulate matter in the atmosphere, smoke from wildfires can penetrate deep into the lungs and cause a range of health problems. Satellites can give us important information on the movement and thickness of that smoke.
Terra carries the Multi-angle Imaging SpectroRadiometer (MISR) instrument, a sensor that uses nine fixed cameras, each viewing Earth at a different angle. MISR measures the motion and height of a fire’s smoke plume, as well as the amount of smoke particles coming from that fire, and gives some clues about the plume’s composition. For example, during the Camp Fire, MISR measurements showed a plume made of large, non-spherical particles over Paradise, California, an indication that buildings were burning. Researchers have established that building smoke leads to larger and more irregularly shaped particles than wildfires. Smoke particles from the burning of the surrounding forest, on the other hand, were smaller and mostly spherical. MISR’s measurements also showed the fire had lofted smoke nearly 2 miles into the atmosphere and carried it about 180 miles downwind, toward the Pacific Ocean.
Scientists also closely monitor whether the height of the smoke has exceeded the “near surface boundary layer,” where pollution tends to concentrate. Wildfires with the most energy, such as boreal forest fires, are the most likely to produce smoke that goes above the boundary layer. At that height, “smoke can typically travel farther, stay in the atmosphere longer, and have an impact further downwind,” Kahn said.
The satellites have limitations. Among them, the heat signatures the instruments detect are averaged over pixels, which makes it difficult to precisely pinpoint fire location and size. Interpreting data from satellites has additional challenges. Although thermal signals give an indication of fire intensity, smoke above the fire can diminish that signal, and smoldering fires might not radiate as much energy as flaming fires at the observed spectral bands.
Up Close with Airborne ‘Heat’ Sensors
That’s where the instruments on the Forest Service aircraft come in. Data from these flights contribute to the National Infrared Operations Program (NIROPS), which uses tools developed with NASA to visualize wildfire information in web mapping services, including Google Earth. NASA works closely with the Forest Service to develop new technologies for the kind of thermal sensing systems these planes carry.
Each NIROPS plane is equipped with an infrared sensor that sees a six-mile swath of land below and can map 300,000 acres of terrain per hour. From an altitude of 10,000 feet, the sensor can detect a hotspot just 6 inches across, and place it within 12.5 feet on a map. The data from each pass are recorded, compressed and immediately downlinked to an FTP site, where analysts create maps that firefighters can access directly on a phone or tablet in the field. They fly at night when there’s no sun glint to compromise their measurements, the background is cooler, and the fires are less aggressive.
“Every time we’re scanning, we’re ‘truthing’ that fire,” says Charles “Kaz” Kazimir, an infrared technician with NIROPS, who has flown fires with the program for 10 years. “On the ground, they may have ideas of how that fire is behaving, but when they get the image, that’s the truth. It either validates or invalidates their assumption since the last time they had intel.”
The infrared aircraft instruments fill some of the gaps in the satellite data. Field campaigns, such as the NASA-NOAA FIREX-AQ, now underway, are designed to address these issues too. But scientists are also looking to new technology. In 2003, representatives from NASA and the Forest Service formed a tactical fire remote sensing committee, which meets twice annually to discuss ways to harness new and existing remote sensing technology as it relates to wildfires. For example, a new infrared sensor is being developed that scans a swath three times wider than the existing system. That would mean fewer flight lines and less time spent over an individual fire, Hinkley said.
“The takeaway really is that we are actively investigating and developing capabilities that will aid decision-makers on the ground, especially in the early phases of dynamic fires,” Hinkley said. “We’re not just resting on our laurels here. We understand that we need to better leverage new technologies to help keep people safe.”
More information on the role of NASA and NOAA satellites and instruments in active fires can be found here: https://www.nasa.gov/feature/goddard/2018/nasa-covers-wildfires-from-many-sources.
Learn more about freely available NASA fire data and related resources: https://earthdata.nasa.gov/learn/toolkits/wildfires.

