News | April 16, 2018
March 2018 was one of six warmest Marches on record
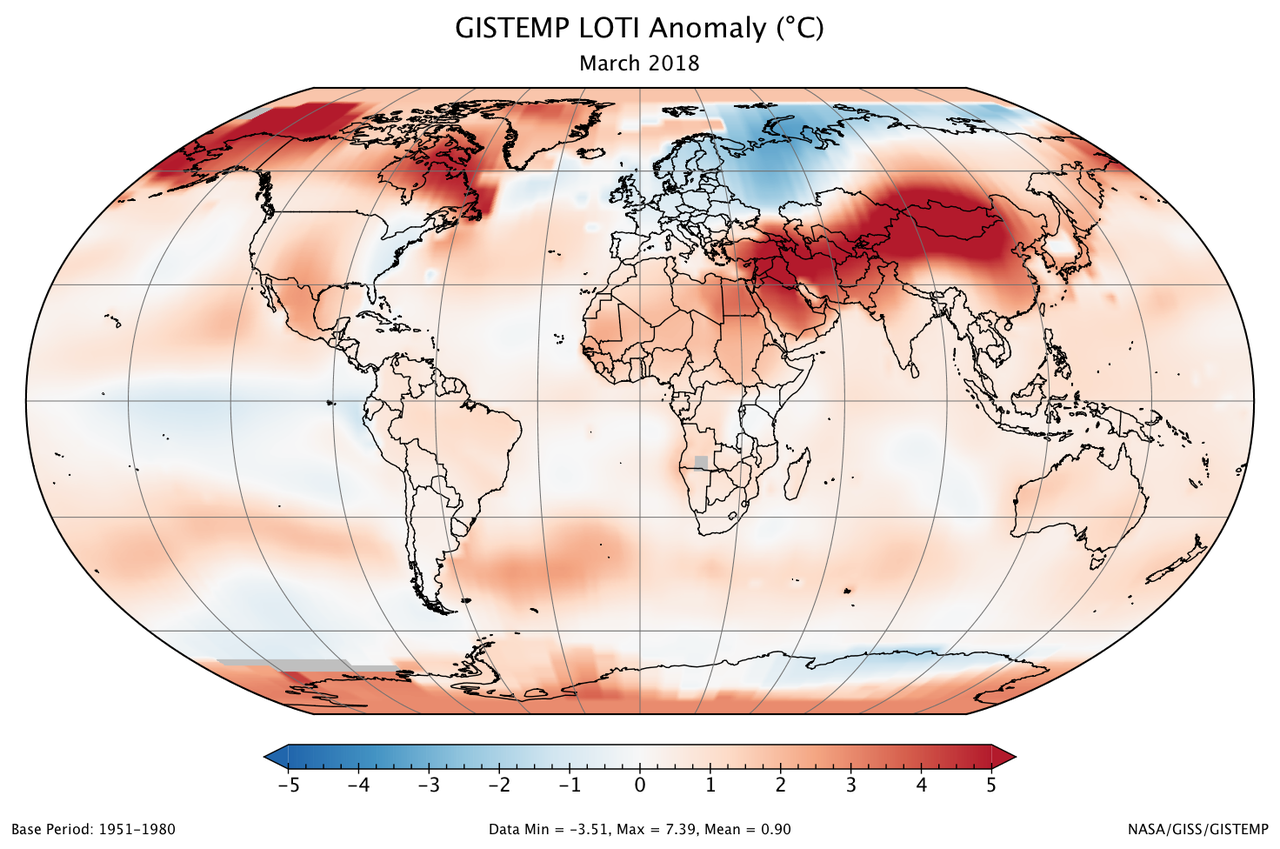
A global map of the March 2018 LOTI (land-ocean temperature index) anomaly, relative to the 1951-1980 March average. View larger image.
March 2018 was +0.89 °C warmer than the average March of the 1951-1980 period. This value is lower than the two hottest years of the record — March 2016 (+1.30 °C) and March 2017 (+1.12 °C) — and is comparable with the years 2002, 2010, and 2015, which cluster tightly around +0.9 °C. The corresponding number for all other years in our 138 years of modern record-keeping is at or below +0.77 °C.

The monthly analysis by the GISS team is assembled from publicly available data acquired by about 6,300 meteorological stations around the world, ship- and buoy-based instruments measuring sea surface temperature, and Antarctic research stations.
The modern global temperature record begins around 1880 because previous observations didn't cover enough of the planet. Monthly analyses are sometimes updated when additional data becomes available, and the results are subject to change.
Related links
For more information on NASA GISS's monthly temperature analysis, visit data.giss.nasa.gov/gistemp.
For more information about NASA GISS, visit www.giss.nasa.gov.
Media contact
Leslie McCarthy, NASA Goddard Institute for Space Studies, New York, N.Y., 212-678-5507, leslie.m.mccarthy@nasa.gov
PDF documents require the free Adobe Reader or compatible viewing software to be viewed.


