3 min read

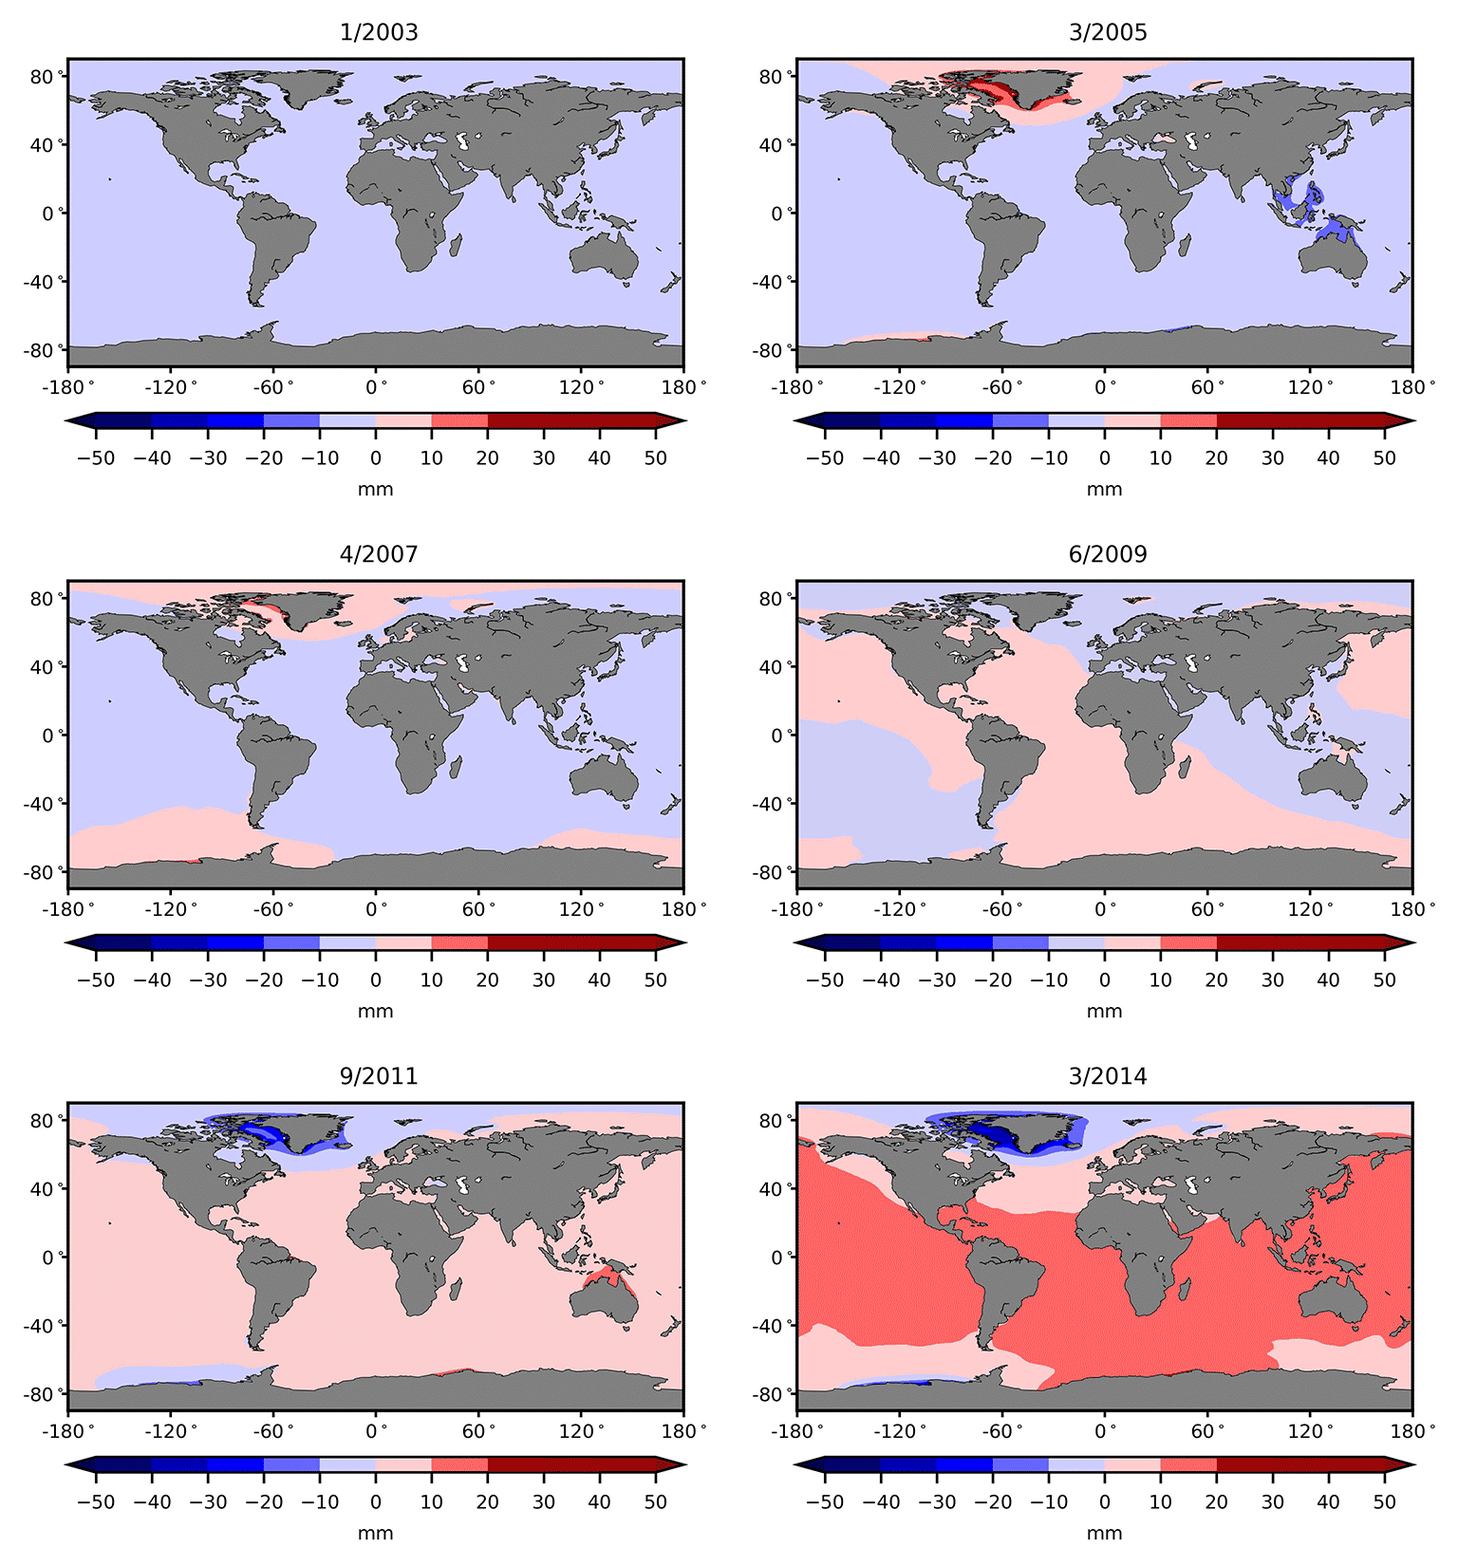
Researchers from NASA’s Jet Propulsion Laboratory in Pasadena, California, and the University of California, Irvine, have reported the first detection of sea level “fingerprints” in ocean observations: detectable patterns of sea level variability around the world resulting from changes in water storage on Earth’s continents and in the mass of ice sheets. The results will give scientists confidence they can use these data to determine how much the sea level will rise at any point on the global ocean as a result of glacier ice melt.
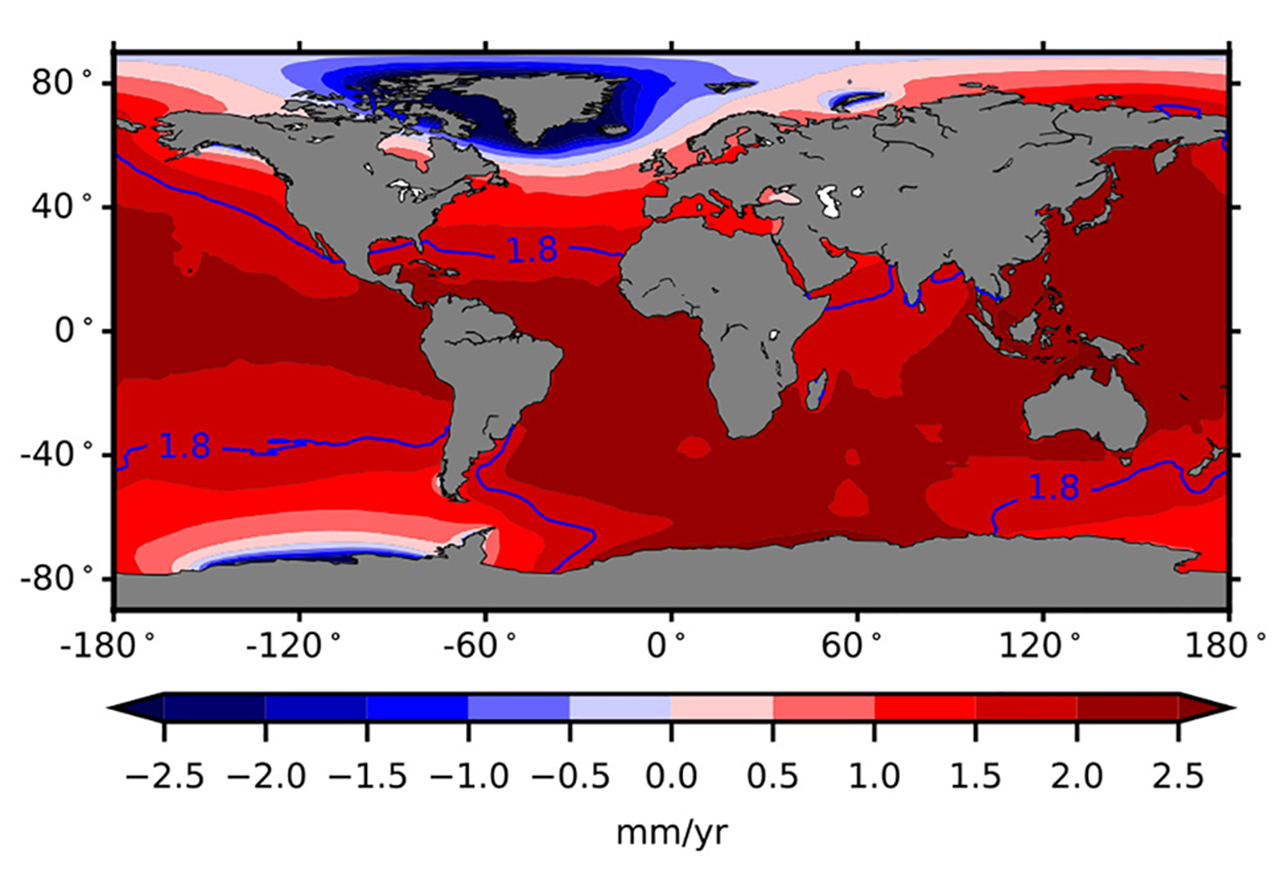
As ice sheets and glaciers undergo climate-related melting, they alter Earth’s gravity field, resulting in sea level changes that aren’t uniform around the globe. For example, when a glacier loses ice mass, its gravitational attraction is reduced. Ocean waters nearby move away, causing sea level to rise faster far away from the glacier. The resulting pattern of sea level change is known as a sea level fingerprint. Certain regions, particularly in Earth’s middle and low latitudes, are hit harder, and Greenland and Antarctica contribute differently to the process. For instance, sea level rise in California and Florida generated by the melting of the Antarctic ice sheet is up to 52 percent greater than its average effect on the rest of the world.

To calculate sea level fingerprints associated with the loss of ice from glaciers and ice sheets and from changes in land water storage, the team used gravity data collected by the twin satellites of the U.S./German Gravity Recovery and Climate Experiment (GRACE) between April 2002 and October 2014. During that time, the loss of mass from land ice and from changes in land water storage increased global average sea level by about 0.07 inch (1.8 millimeters) per year, with 43 percent of the increased water mass coming from Greenland, 16 percent from Antarctica and 30 percent from mountain glaciers. The scientists then verified their calculations of sea level fingerprints using readings of ocean-bottom pressure from stations in the tropics.
“Scientists have a solid understanding of the physics of sea level fingerprints, but we’ve never had a direct detection of the phenomenon until now,” said co-author Isabella Velicogna, UCI professor of Earth system science and JPL research scientist.
“It was very exciting to observe the sea level fingerprints in the tropics, far from the glaciers and ice sheets,” said lead author Chia-Wei Hsu, a graduate student researcher at UCI.
The findings are published today in the journal Geophysical Research Letters. The research project was supported by UCI and NASA’s Earth Science Division.
GRACE is a joint NASA mission with the German Aerospace Center (DLR) and the German Research Center for Geosciences (GFZ), in partnership with the University of Texas at Austin.


