3 min read
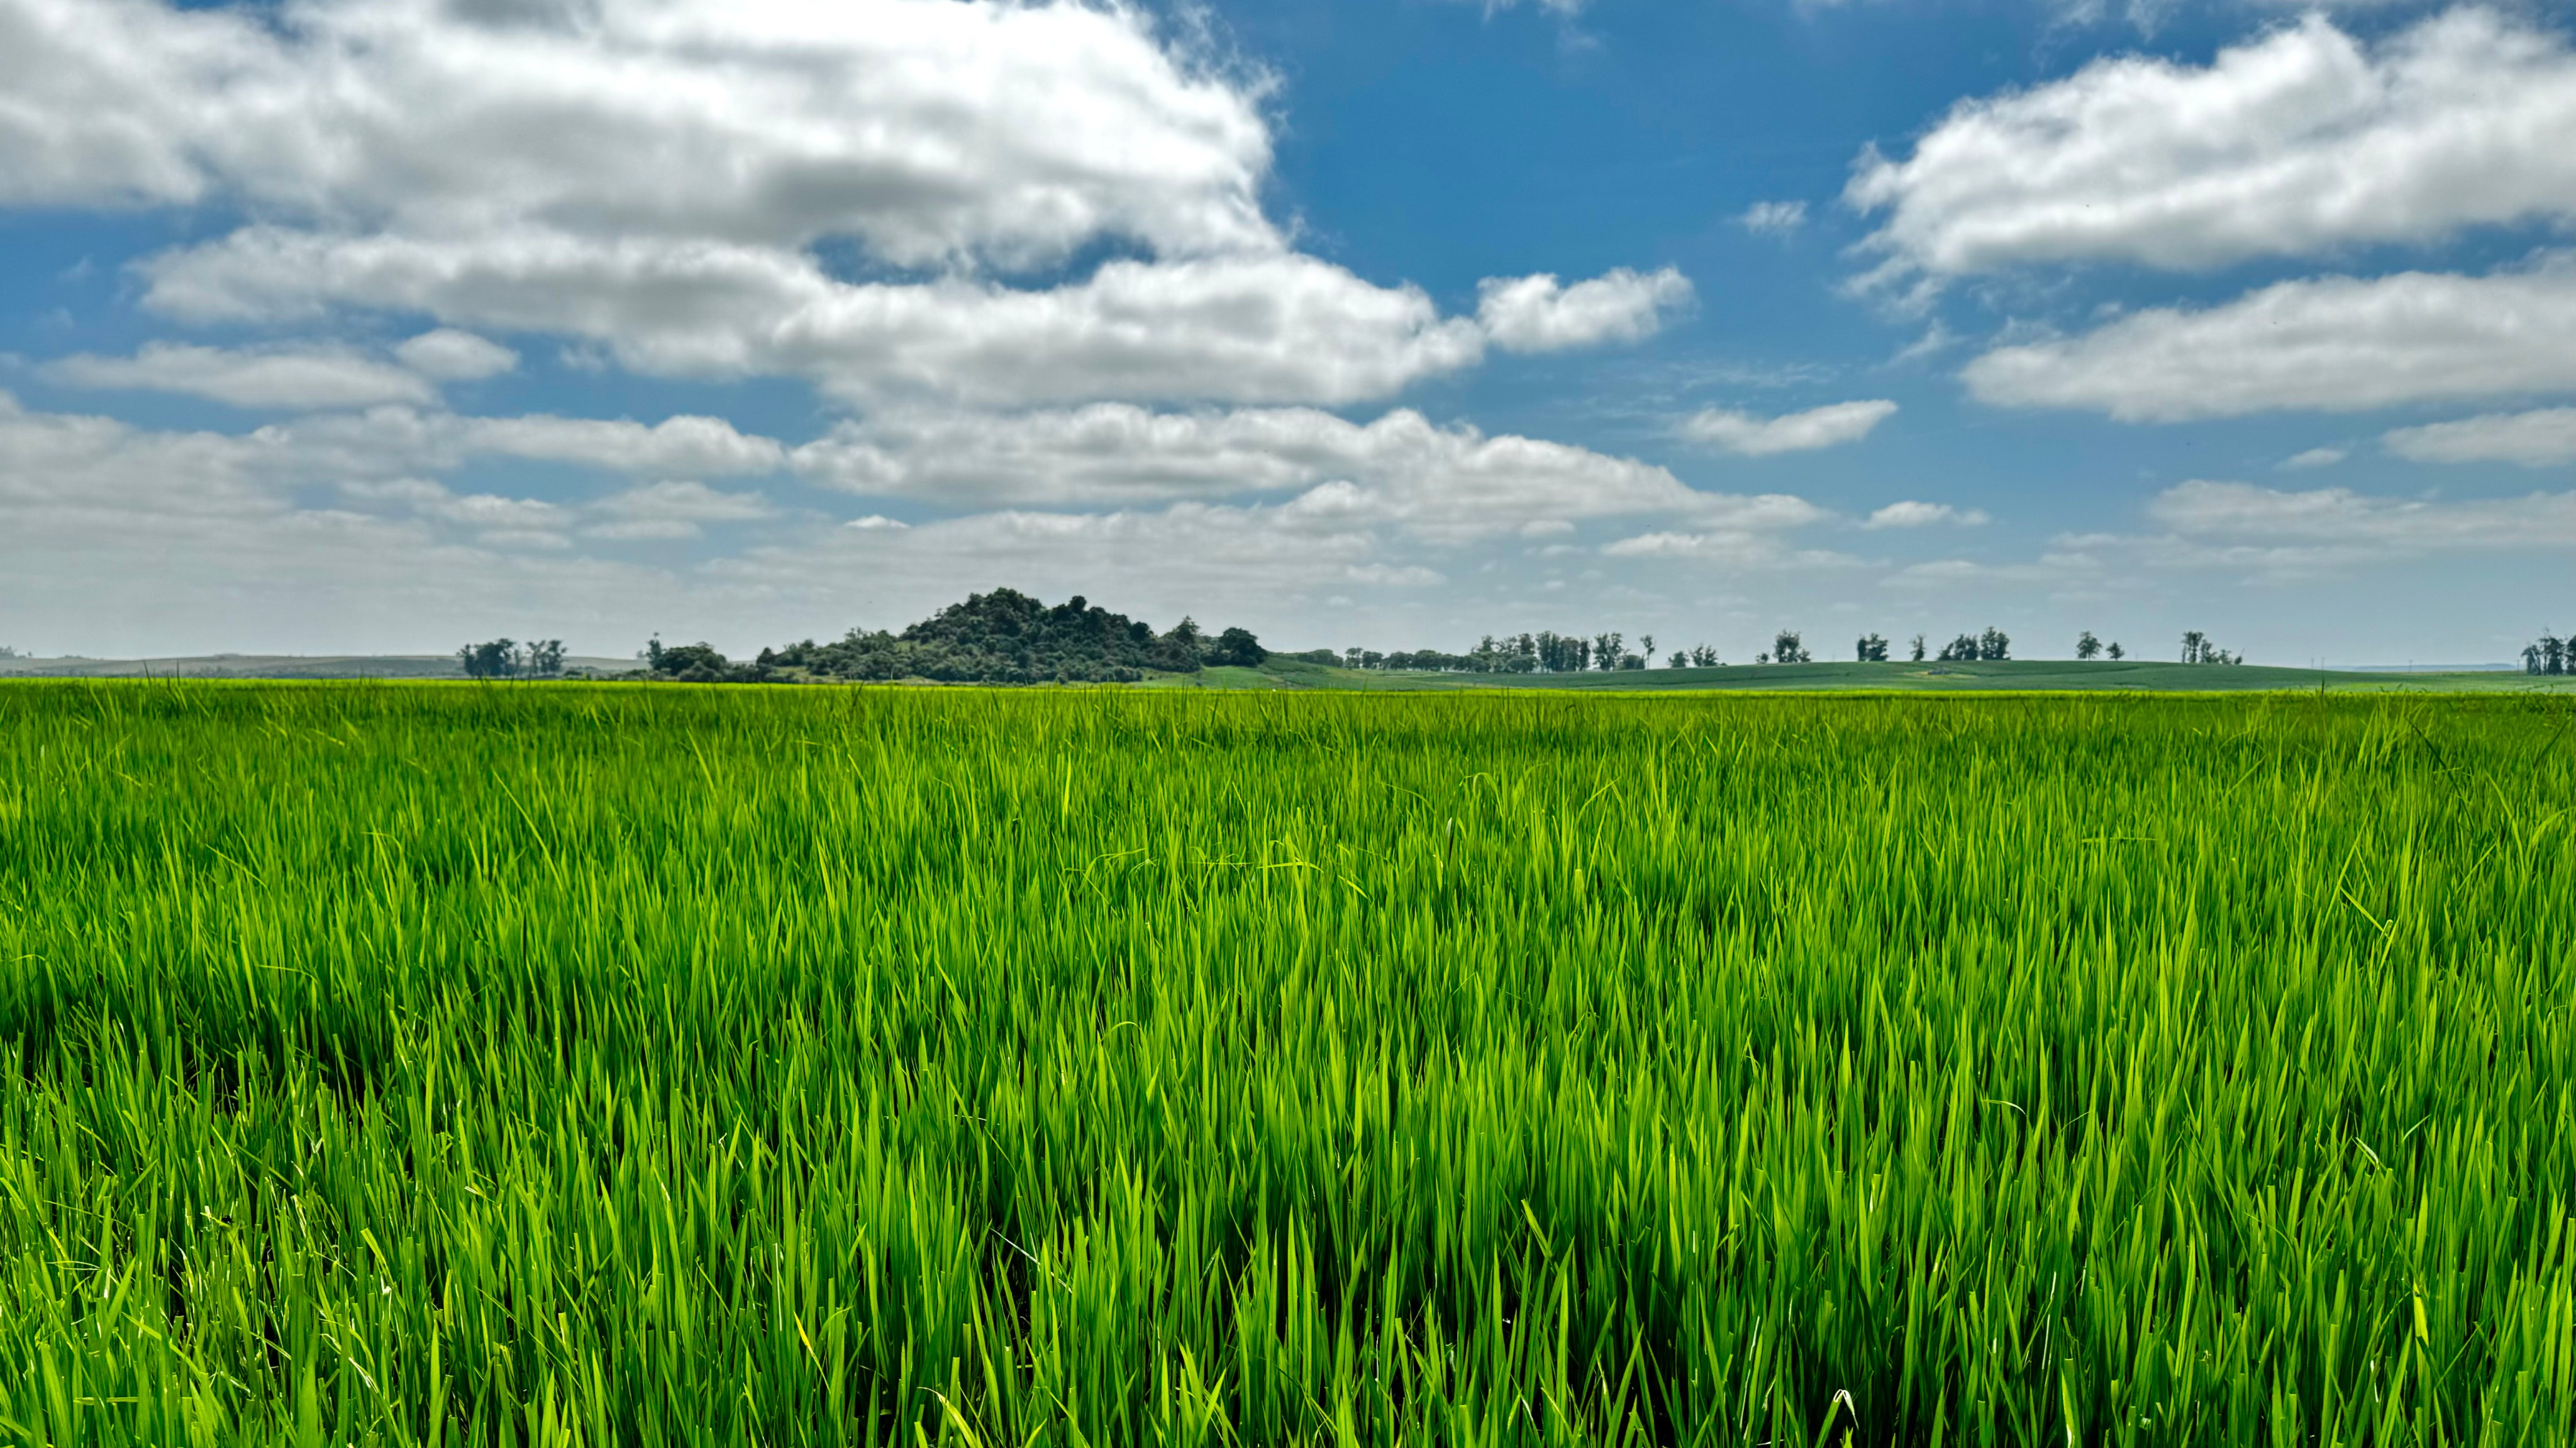
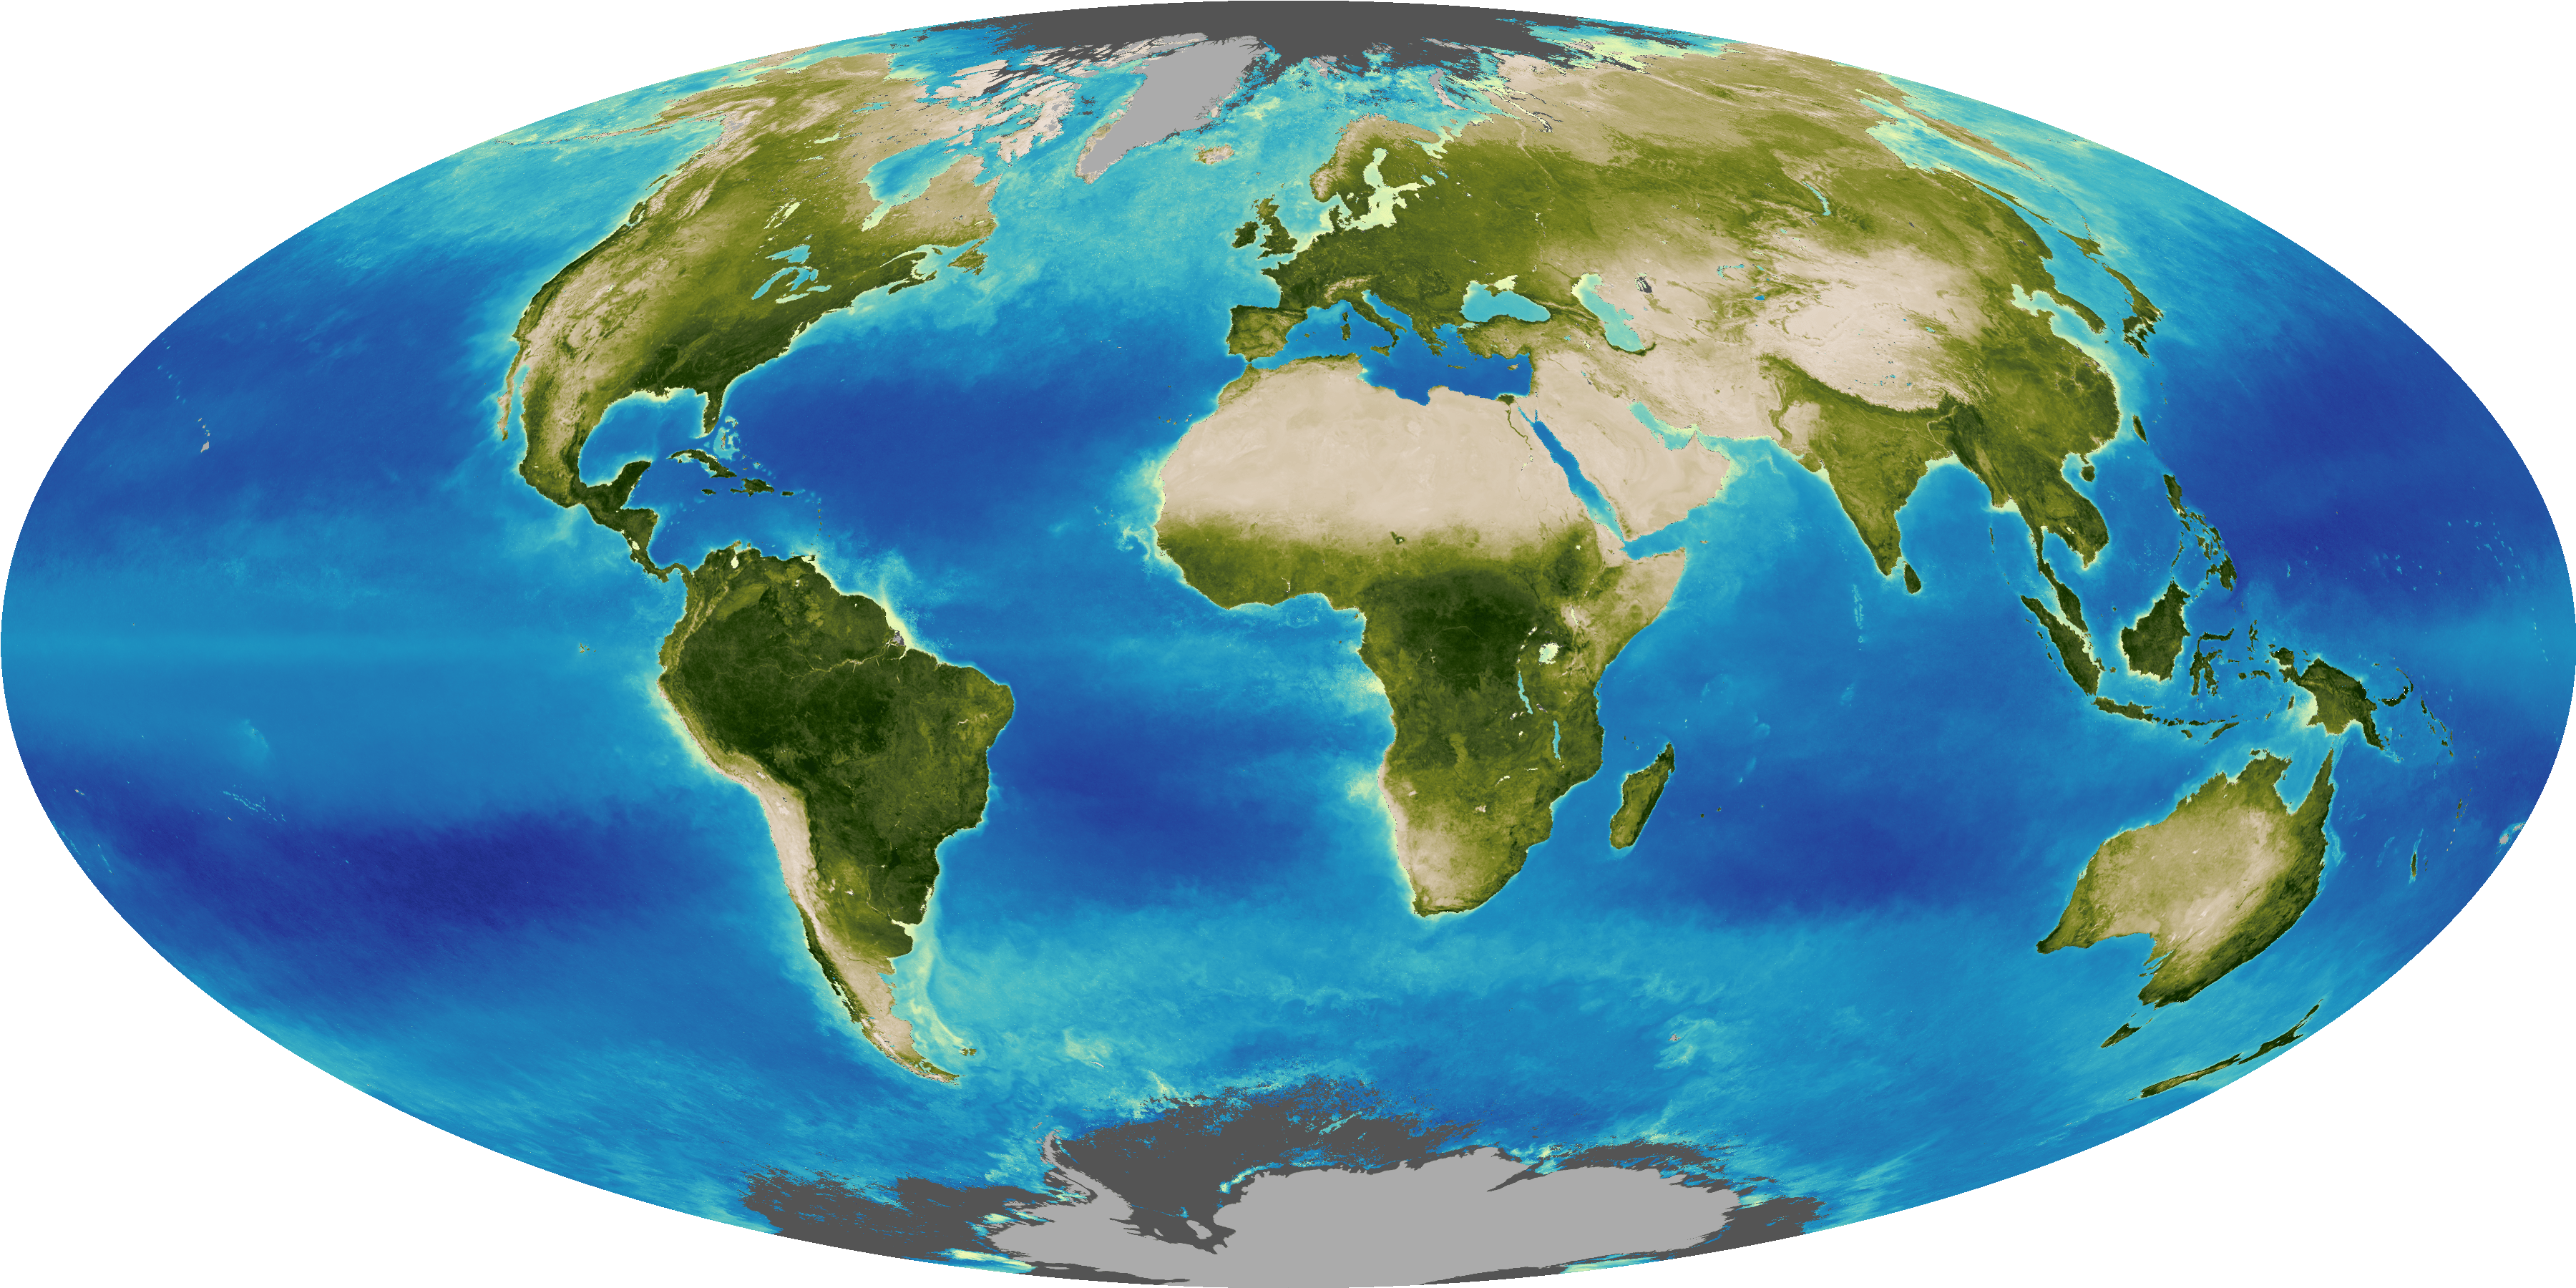
Each year during the Northern Hemisphere spring, the greening of the planet begins. Trees sprout their leaves, plants grow and vegetation takes hold north of the equator, where nearly 70 percent of Earth’s total land mass lies.
As photosynthesis ramps up, plants breathe in carbon dioxide (CO2), and atmospheric levels of CO2 begin to drop. Then in fall and winter, when trees lose their leaves and foliage declines, CO2 levels begin to rise again. This up-and-down sequence creates an annual cycle of minimum and maximum levels of atmospheric CO2.
“The exchange between vegetation and the atmosphere makes this sort of wavy pattern, and what seems to be happening now is that we’re reaching an annual minimum that is above 400 ppm [parts per million],” says Joao Teixeira, Atmospheric Infrared Sounder (AIRS) Science Team leader at NASA's Jet Propulsion Laboratory (JPL). “Unless something dramatic happens with humans and the planet, it will never be 400 again in the next several decades."
Seeing global concentrations above the 400 ppm threshold at a time of year when atmospheric CO2 is typically at its lowest level is a critical turning point.
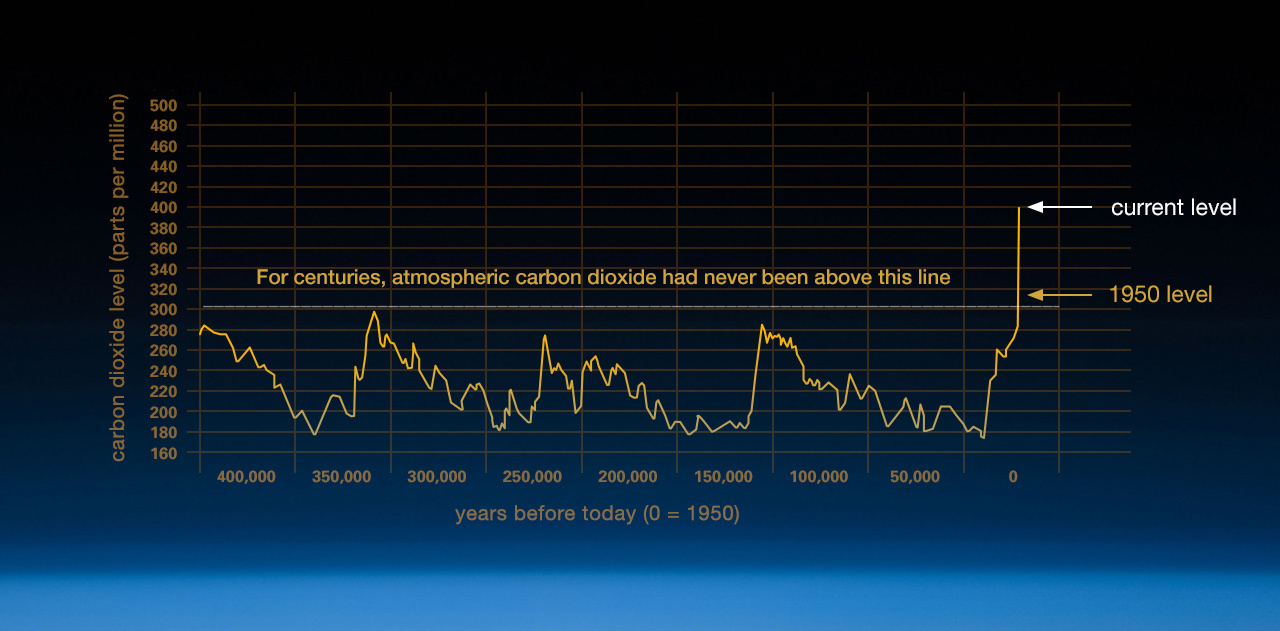
Ice core records show that until the Industrial Revolution, atmospheric CO2 levels remained fairly steady at around 280 ppm. By 1961, CO2 data collected at a monitoring station at the summit of Hawaii’s Mauna Loa volcano showed that atmospheric CO2 levels were rising steadily by about 2 ppm per year. Nearly half a century later, in 2005, CO2 concentrations had increased to 380 ppm.
The station at Mauna Loa is considered the “gold standard” for monitoring atmospheric CO2 from the surface. But the 2002 launch of the AIRS instrument made it possible for researchers to map CO2 levels in the troposphere on a global scale. “Suddenly, we have measurements over the ocean, over the land and over the poles, and now we can track these levels over time,” says Edward Olsen, a scientist and AIRS team member at NASA JPL.
In May 2013, the Mauna Loa station recorded CO2 levels above the benchmark 400 ppm for the first time. Although that measurement marked a climate milestone, AIRS data have now confirmed a more significant landmark: the annual minimum CO2 level has now exceeded 400 ppm—not just in one location, but over the entire globe. “We take these measurements all over the world in different places, and we average everything out,” says Teixeira. “So AIRS gives us the global mean value of CO2 in the troposphere.”
New territory
Seeing global concentrations above the 400 ppm threshold at a time of year when atmospheric CO2 is typically at its lowest level is a critical turning point. “The significance of the minimum exceeding 400 ppm is that the natural processes that draw down atmospheric CO2 are not sufficiently strong to bring the level back down again,” says Olsen.
“Unfortunately, how things will change is still not totally clear,” says Teixeira. “But even if we stopped emitting right now, we will have enough CO2 to still have an increase in temperatures.”

