Graphic: Carbon Dioxide Emissions as Pumpkins

| Credit | NASA/JPL-Caltech |
|---|---|
| Language |
|
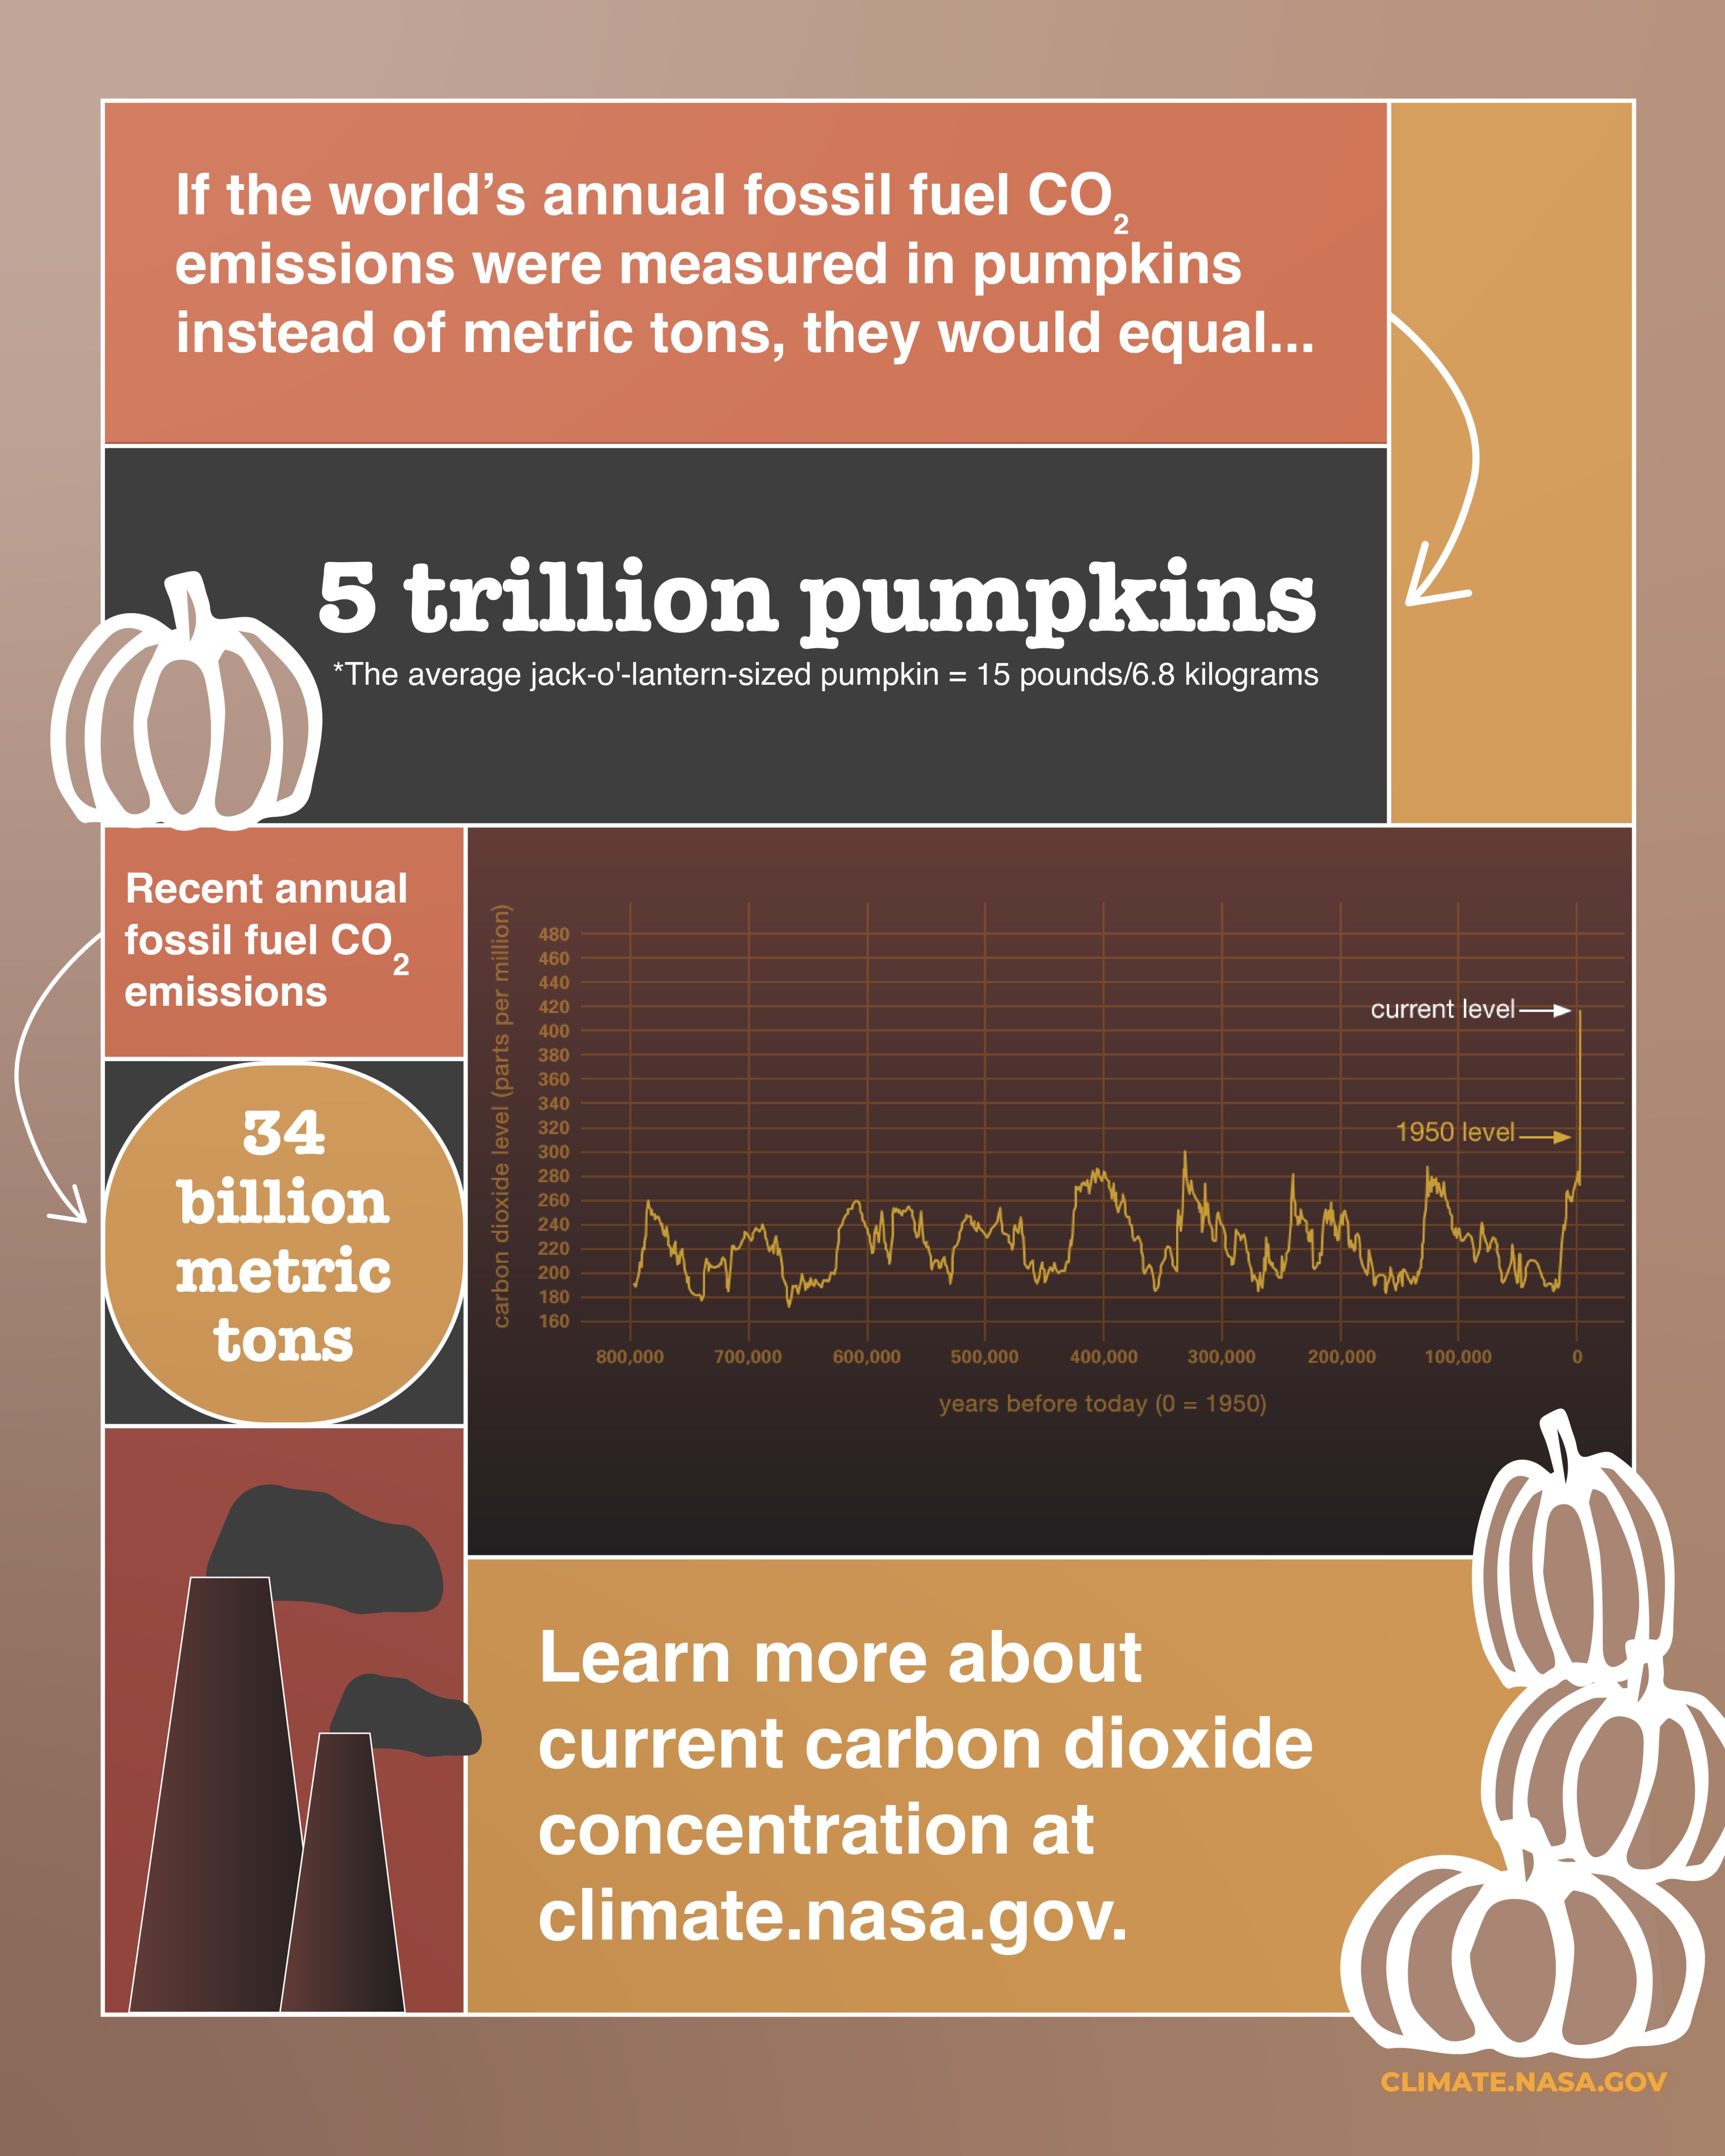
Trick or treat? How many pumpkins would it take to equal the mass of the world’s annual fossil fuel carbon dioxide (CO₂) emissions? Hint: This isn’t a trick 👻
Image Description:
A graphic with eight fall-colored boxes coming in light orange, gold, navy blue, or light maroon, all on a tan background. It starts with the text "If the world’s annual fossil fuel CO2 emissions were measured in pumpkins instead of metric tons, they would equal..."
The box below reads “5 trillion pumpkins” and “*The average jack-o’-lantern-sized pumpkin = 15 pounds/6.8 kilograms.” Another box says “Recent annual fossil fuel CO2 emissions,” with the one below that reading “34 billion metric tons.” The last text box says “Learn more about current carbon dioxide concentration at climate.nasa.gov.”
There’s a “climate.nasa.gov” logo at the bottom right in small gold text. A graph showing carbon dioxide levels over the past 800,000 years, with the current level being at 419 parts per million (ppm), is at the center of the graphic. Drawn white-outlined pumpkins are toward the upper left and at the lower right of the graphic, and two cartoon smokestacks are at the lower left.

