NASA
Global Climate Change
Vital Signs of the Planet
Skip Navigation
menu close modal

MULTIMEDIA

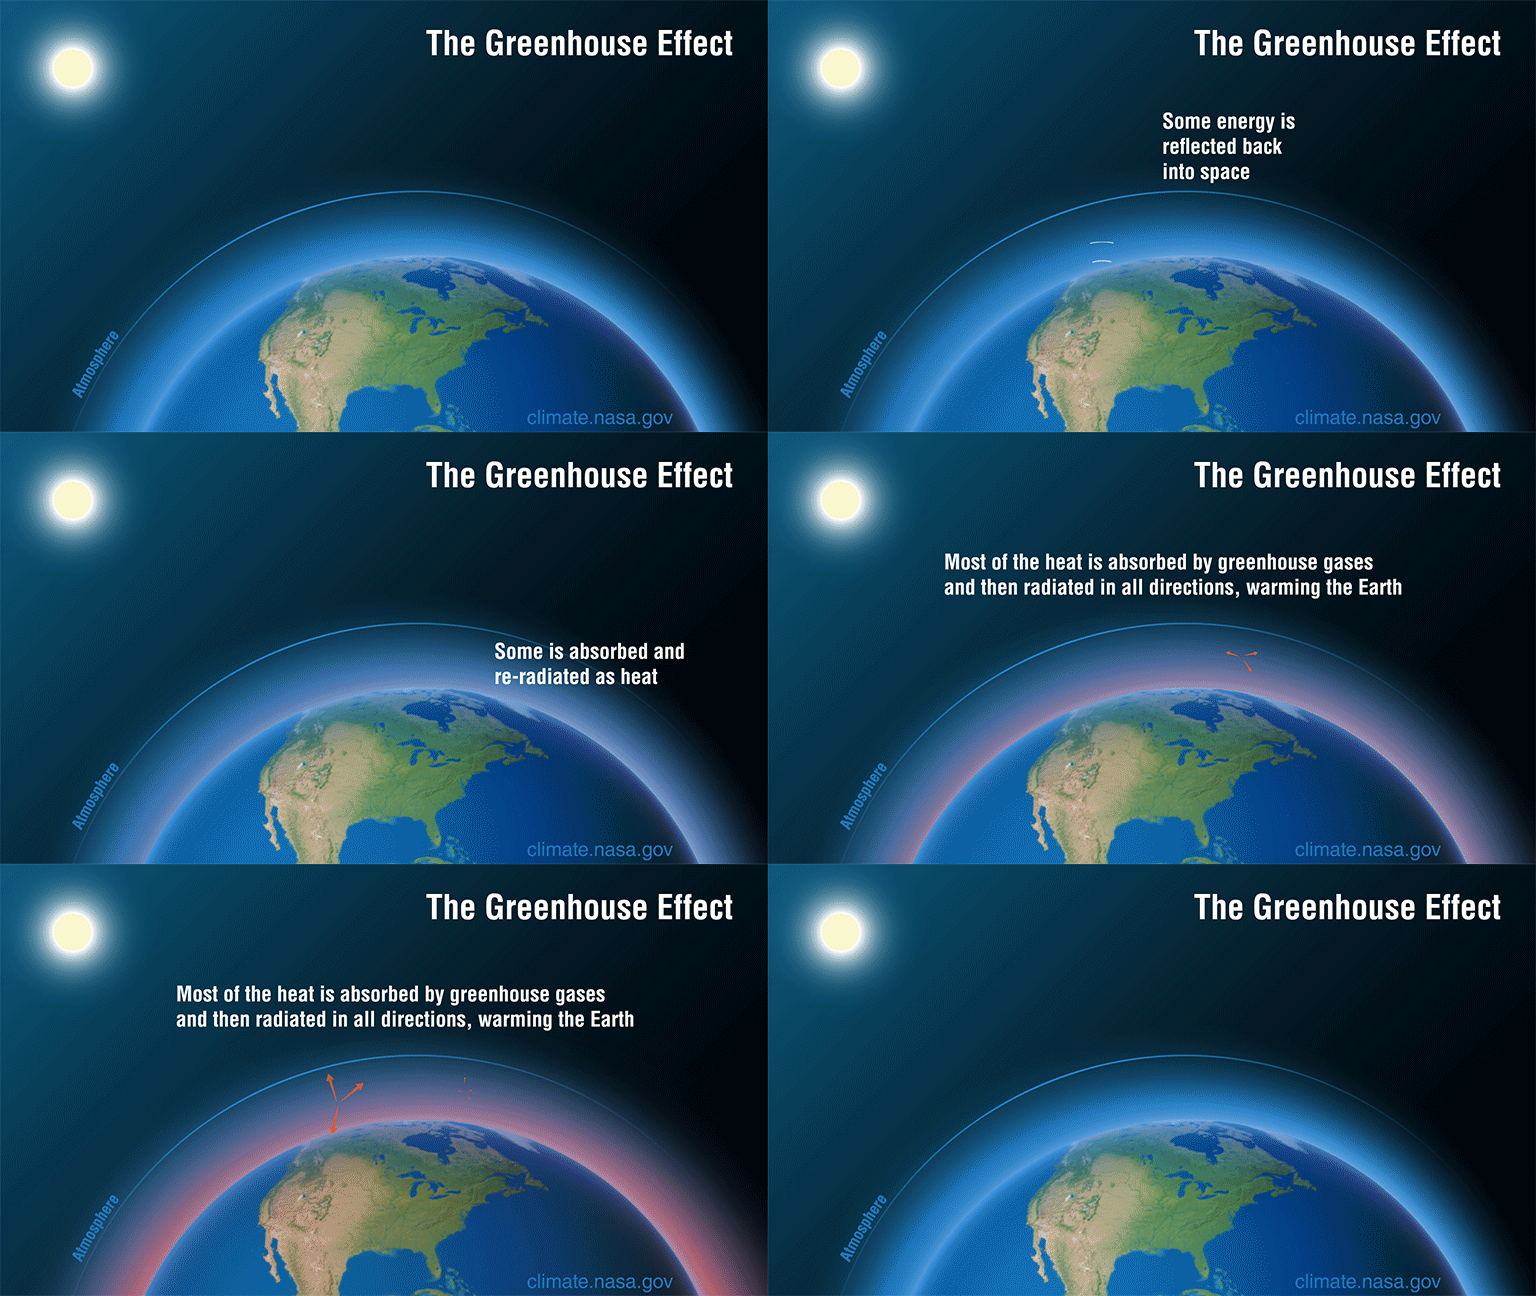
Graphic: The Greenhouse Effect
greenhouse effect 11/5/20

May 22, 2019

A simplified animation of the greenhouse effect.

Also find this animated gif on our Causes page.

Credit

NASA-JPL/Caltech

Downloads

768x432
7.44 MB
image/gif
Download
1920x1080
5.33 MB
video/mp4
Download
en español 1920x1080
5.54 MB
video/mp4
Download
en español 768px
7.22 MB
image/gif
Download

More Like This

  • Graphics
  • Atmosphere
  • Global warming

Related

Video: A visualization of the annual Arctic sea ice "minimum" for each year from 1979 through 2022.
More
Annual Arctic sea ice minim...
Video: Annual Arctic Sea Ice Minimum 1979-2022 with Area Graph
A graphic briefly explains the relationship between volcanoes and climate change.
More
Graphic: Volcanoes and Clim...
Graphic: Volcanoes and Climate Change
Test your knowledge of how Earth is different from other planets, both within our solar system and beyond.
More
Test your knowledge of how ...
Quiz: Our world, other worlds
Salinity plays a major role in global ocean circulation and changes in salinity may impact regional and global climates. NASA's Aquarius mission is painting a global picture of our planet's salty waters.
More
Salinity plays a major role...
Video: Aquarius
Video: Using observations from NASA's Orbiting Carbon Observatory (OCO-2) satellite, scientists developed a model of the behavior of carbon in the atmosphere from September 1, 2014 to August 31, 2015.
More
Following carbon dioxide th...
Video: Following atmospheric carbon dioxide
This animation shows how global sea levels have risen more than 80 millimeters (3.15 inches) over the past three decades, which is like covering the U.S. in about 4 meters (about 13 feet) of water over that period.
More
Animation: Global Sea Level...
Animation: Global Sea Level Change (1992-2017)
A detailed look at Jupiter's and Earth's atmospheres and cores as we unlock mysteries of the solar system.
More
Jupiter and Earth: Giant di...
Infographic: Jupiter and Earth: Giant discoveries ahead
How much do you know about glaciers and ice caps?
More
Test your knowledge of the ...
Quiz: Ice and glaciers
Quiz: Carbon and the climate
More
Quiz: Carbon and the climate
Video: Images created from GRACE data showing changes in Greenland ice mass since 2002.
More
Greenland ice loss 2002-2016
Video: Greenland ice loss 2002-2016
This documentary traces the efforts of NASA’s Jet Propulsion Laboratory to measure greenhouse gases.
More
JPL and the Space Age: Sky ...
JPL and the Space Age: Sky High (Video)
Land. Water. Fire. Ice. These elements are basic ingredients that make up planet Earth. Take a moment to admire the magnificent spectacle of our stunning home planet from the perspective of space.
More
Land. Water. Fire. Ice. The...
Video: Majestic Planet
Antes de la Revolución Industrial, el clima de la Tierra cambiaba debido a eventos naturales como la actividad volcánica y las variaciones de la energía solar.
More
Los sospechosos de siempre
An animation shows global sea level trends from 1993 to 2022 as observed by several satellite missions.
More
Video: Tracking 30 Years of...
Video: Tracking 30 Years of Sea Level Rise
Continuing key Earth observations is really important to see how our atmosphere, land, and ocean are changing over time. A long-term record, combined with cutting-edge observations from the new NASA Earth System Observatory, will continue to push boundaries to better understand our ever-changing planet.
More
How NASA Satellites Help Mo...
How NASA Satellites Help Model the Future of Climate
Ice covers 10 percent of Earth's surface and helps moderate the planet's temperature. Glaciers and ice sheets around the world are melting at an alarming rate. By keeping an eye on Earth's ice from space, NASA satellites help us understand the global effects of climate change.
More
Ice covers 10 percent of Ea...
Video: Frozen Earth
Los aerosoles son diminutas partículas sólidas y líquidas suspendidas en la atmósfera.
More
Me llamo Aerosol
Me llamo Aerosol
This visualization shows that as land temperatures have increased since 1950, hotter days have become more common and colder days have become less common.
More
Watching the Land Temperatu...
Watching the Land Temperature Bell Curve Heat Up (1950-2020)
Desde 1978, la NASA ha estado monitoreando los vientos oceánicos a través de la dispersometría, cuyos datos han mejorado los pronósticos meteorológicos y de huracanes y nos han ayudado a comprender mejor los patrones climáticos globales.
More
Los vientos oceánicos
Oceanographer Josh Willis discusses the heat capacity of water, performs an experiment to demonstrate heat capacity using a water balloon and describes how water's ability to store heat affects Earth's climate.
More
Oceanographer Josh Willis d...
Video: Oceans of Climate Change
Quiz: Our home planet
More
Quiz: Our home planet
The visualization shows monthly global temperature anomalies (changes from an average) between the years 1880 and 2022.
More
Video: Climate Spiral (1880...
Video: Climate Spiral (1880-2022)
Every summer, phytoplankton spread across the North Atlantic, with blooms spanning hundreds and sometimes thousands of miles. Blooms off Scandinavia seem to be particularly intense in summer 2018.
More
A vortex of lighter green p...
Summer blooms in the Baltic
The relentless rise of carbon dioxide levels in the atmosphere.
More
The inexorable rise of carb...
Graphic: The relentless rise of carbon dioxide
This image shows a spinning formation of ice, clouds and low-lying fog off the eastern coast of Greenland. This image was acquired by the Landsat 7 satellite on May 14, 2001. This is a false-color composite image made using infrared, red and green wavelengths.
More
Whirlpool
Whirlpool
more resources

Explore

Interactives, galleries and apps

Images of Change

Images of Change

Explore a stunning gallery of before-and-after images of Earth from land and space that reveal our home planet in a state of flux.
More
Climate Time Machine

Climate Time Machine

Travel through Earth's recent climate history and see how increasing carbon dioxide, global temperature and sea ice have changed over time.
More
Eyes on the Earth

Eyes on the Earth

Track Earth's vital signs from space and fly along with NASA's Earth-observing satellites in an interactive 3D visualization.
More
Global Ice Viewer

Global Ice Viewer

Earth's ice cover is shrinking. See how climate change has affected glaciers, sea ice, and continental ice sheets.
More
more multimedia

Get the Newsletter

Stay Connected

Facts

    • Evidence
    • Causes
    • Effects
    • Scientific Consensus
    • What Is Climate Change?
    • Vital Signs
    • Extreme Weather
    • Questions (FAQ)

News

    • News and Features
    • Subscribe
    • Climate Newsletter Archive

Solutions

    • Earth Science in Action
    • Mitigation and Adaptation
    • Sustainability and Government Resources

Explore

    • Images of Change
    • Earth Minute Videos
    • Interactives
    • Beautiful Earth Gallery
    • Ask NASA Climate

NASA Science

    • Science Mission Directorate
    • NASA Data Resources
    • Earth System Science
    • Earth Science Missions
    • History
    • People

More

    • For Media
    • For Educators
    • Multimedia
    • En español
    • For Kids
    • About Us
  • Feedback
  • |
  • Awards
  • |
  • Sitemap
  • |
  • Earth Observatory
  • |
  • SEA LEVEL CHANGE
  • |
  • Privacy
  • |
  • Climate Data Initiative
  • |
  • U.S. CLIMATE RESILIENCE TOOLKIT

This website is produced by the Earth Science Communications Team at

NASA's Jet Propulsion Laboratory | California Institute of Technology

Site Owner: Anya Biferno
Site Editor: Holly Shaftel
Managing Editor: Susan Callery
Senior Producer: Randal Jackson
Senior Science Editor: Daniel Bailey
Science Editor: Susan Callery

Site last updated: September 21, 2023