NASA
Global Climate Change
Vital Signs of the Planet
Skip Navigation
menu close modal

MULTIMEDIA

Interactive: Eyes on the Earth
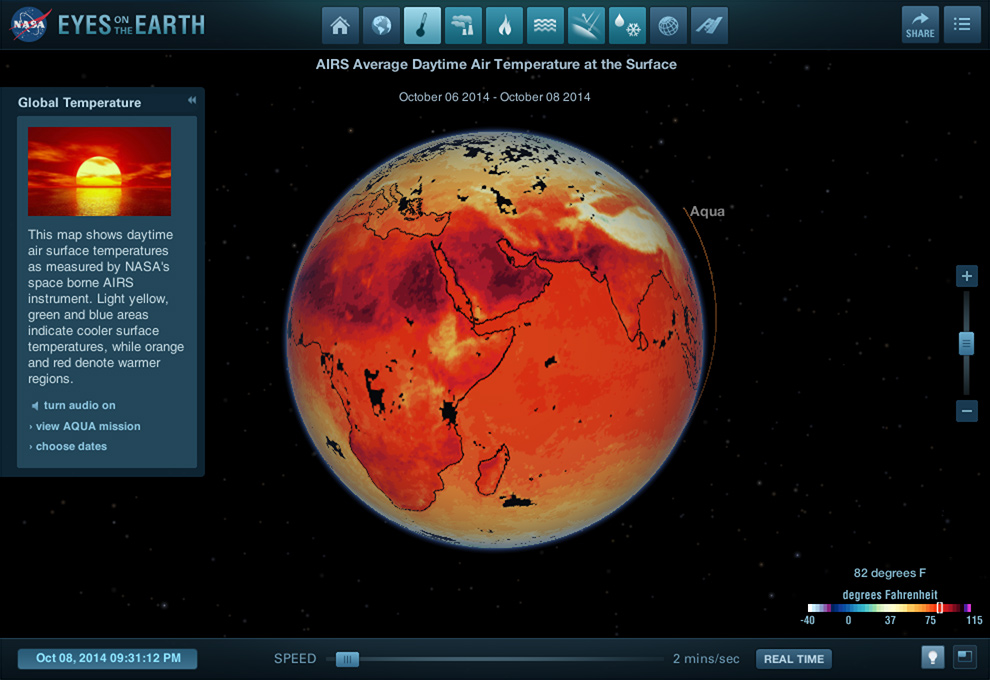
Eyes on the Earth

Track Earth's vital signs and fly along with NASA's Earth-observing satellites. See natural hazards from space, view near real-time science data and keep an Eye on our planet's heath with this stunning 3D visualization.

› launch full-screen visualization

Enlarge

More Like This

  • Interactives
  • Atmosphere
  • Land change
  • Oceans and ice

Related

Las nubes son complicadas cuando se trata de la ciencia del clima, ya que calientan y enfrían la Tierra.
More
Las nubes.
Las nubes
Oceanographer Josh Willis discusses the heat capacity of water, performs an experiment to demonstrate heat capacity using a water balloon and describes how water's ability to store heat affects Earth's climate.
More
Oceanographer Josh Willis d...
Video: Oceans of Climate Change
This animation compares sea surface salinity (saltiness) data from two NASA datasets from 2015 to 2017.
More
Animation: Sea Surface Sali...
Animation: Sea Surface Salinity (Saltiness) Comparison (2015-2017)
B-roll for media on the sea level-observing Sentinel-6 Michael Freilich satellite.
More
Video: Sentinel-6 Michael F...
Video: Sentinel-6 Michael Freilich Media Reel
NASA scientists are working to understand if our land and ocean can continue to absorb carbon dioxide at the current rate – and for how long.
More
Infographic: Earth's carbon...
Infographic: Earth's carbon cycle is off balance
NASA explores. From its earliest days of sounding rockets and balloon-borne instruments, to Apollo and Hubble and missions to Mars. This mission of exploration has also always focused on our own corner of the universe, Earth - the home frontier. Earth is still the only planet we've ever been to, as this video explains.
More
NASA explores. From its ear...
Home Frontier
​ A spring phytoplankton bloom off of the Alaskan coast.
More
Churning in the Chukchi Sea
The carbon dioxide cycle is the movement of carbon dioxide (CO2) between the land, the atmosphere, and the ocean. Print this page to color with your kids at home.
More
Coloring Page: The Carbon D...
Coloring Page: The Carbon Dioxide Cycle
A detailed look at Jupiter's and Earth's atmospheres and cores as we unlock mysteries of the solar system.
More
Jupiter and Earth: Giant di...
Infographic: Jupiter and Earth: Giant discoveries ahead
A series of rocky outcroppings are a prominent feature of this Sahara Desert landscape near the Terkezi Oasis in the country of Chad. This image was taken by the Landsat 7 satellite on October 22, 2000. It is a false-color composite image made using near infrared, green, and red wavelengths. The image has also been sharpened using the sensor's panchromatic band.
More
Terkezi Oasis
Terkezi Oasis
This animation shows how global sea levels have risen more than 80 millimeters (3.15 inches) over the past three decades, which is like covering the U.S. in about 4 meters (about 13 feet) of water over that period.
More
Animation: Global Sea Level...
Animation: Global Sea Level Change (1992-2017)
Sentinel-6 Michael Freilich will join a long-standing family of Earth-observing satellites from NASA and European partners, including EUMETSAT and the French space agency CNES.
More
Video: Sentinel-6 Michael F...
Video: Sentinel-6 Michael Freilich Satellite Family Tree
This visualization shows the complex patterns of methane emissions produced globally from January 2018 to November 2018.
More
Video: Methane Sources
Video: Explore how scientists determine glacial speed from space.
More
At glacial speed
Video: At glacial speed
This visualization depicts changes in Greenland land ice thickness as measured by the ICESat and ICESat-2 satellites.
More
Greenland Land Ice Height C...
Greenland Land Ice Height Change as Measured by ICESat and ICESat-2
Desde 1978, la NASA ha estado monitoreando los vientos oceánicos a través de la dispersometría, cuyos datos han mejorado los pronósticos meteorológicos y de huracanes y nos han ayudado a comprender mejor los patrones climáticos globales.
More
Los vientos oceánicos
This visualization shows total sea level change between 1992 and 2019, based on data collected from the TOPEX/Poseidon, Jason-1, Jason-2, and Jason-3 satellites.
More
Video: 27-Year Sea Level Rise
NASA Earth Right Now promo
More
NASA Earth Right Now promo
Video: NASA Earth Right Now promo
Quiz: Our home planet
More
Quiz: Our home planet
Video: Winter temperatures are soaring in the Arctic for the fourth winter in a row.
More
NASA studies an unusual Arc...
NASA studies an unusual Arctic warming event
Animation showing changes in Greenland ice mass since 2002 based on satellite data.
More
Video: Greenland Ice Mass L...
Video: Greenland Ice Mass Loss 2002-2020
Los aerosoles son diminutas partículas sólidas y líquidas suspendidas en la atmósfera.
More
Me llamo Aerosol
Me llamo Aerosol
Video: total sea level change between 1992 and 2014, based on data collected from the TOPEX/Poseidon, Jason-1 and Jason-2 satellites.
More
Video: 22-year sea level rise
NASA's new Orbiting Carbon Observatory-2 space satellite will probe the carbon cycle like never before, telling us where the carbon is going and giving us clues as to where we will end up.
More
Atmospheric carbon dioxide ...
Graphic: Measuring carbon dioxide from space
Ice covers 10 percent of Earth's surface and helps moderate the planet's temperature. Glaciers and ice sheets around the world are melting at an alarming rate. By keeping an eye on Earth's ice from space, NASA satellites help us understand the global effects of climate change.
More
Ice covers 10 percent of Ea...
Video: Frozen Earth
more resources

Explore

Interactives, galleries and apps

Images of Change

Images of Change

Explore a stunning gallery of before-and-after images of Earth from land and space that reveal our home planet in a state of flux.
More
Climate Time Machine

Climate Time Machine

Travel through Earth's recent climate history and see how increasing carbon dioxide, global temperature and sea ice have changed over time.
More
Eyes on the Earth

Eyes on the Earth

Track Earth's vital signs from space and fly along with NASA's Earth-observing satellites in an interactive 3D visualization.
More
Global Ice Viewer

Global Ice Viewer

Earth's ice cover is shrinking. See how climate change has affected glaciers, sea ice, and continental ice sheets.
More
more multimedia

Get the Newsletter

Stay Connected

Facts

    • Evidence
    • Causes
    • Effects
    • Scientific Consensus
    • Global Warming vs. Climate Change
    • Vital Signs
    • Questions (FAQ)

News

    • News and Features
    • Subscribe
    • Climate Newsletter Archive

Solutions

    • Earth Science in Action
    • Mitigation and Adaptation
    • Sustainability and Government Resources

Explore

    • Images of Change
    • Earth Minute Videos
    • Interactives
    • Beautiful Earth Gallery
    • Ask NASA Climate

NASA Science

    • Science Mission Directorate
    • NASA Data Resources
    • Earth System Science
    • Earth Science Missions
    • History
    • People

More

    • For Media
    • For Educators
    • Multimedia
    • En español
    • For Kids
    • About Us
  • Feedback
  • |
  • Awards
  • |
  • Sitemap
  • |
  • Earth Observatory
  • |
  • SEA LEVEL CHANGE
  • |
  • Privacy
  • |
  • Climate Data Initiative
  • |
  • U.S. CLIMATE RESILIENCE TOOLKIT

This website is produced by the Earth Science Communications Team at

NASA's Jet Propulsion Laboratory | California Institute of Technology

Site Editor: Holly Shaftel
Managing Editor: Susan Callery
Senior Producer: Randal Jackson
Senior Science Editor: Daniel Bailey
Science Editor: Susan Callery

Site last updated: May 25, 2023