Climate Change
From the unique vantage point in space, NASA collects critical long-term observations of our changing planet.

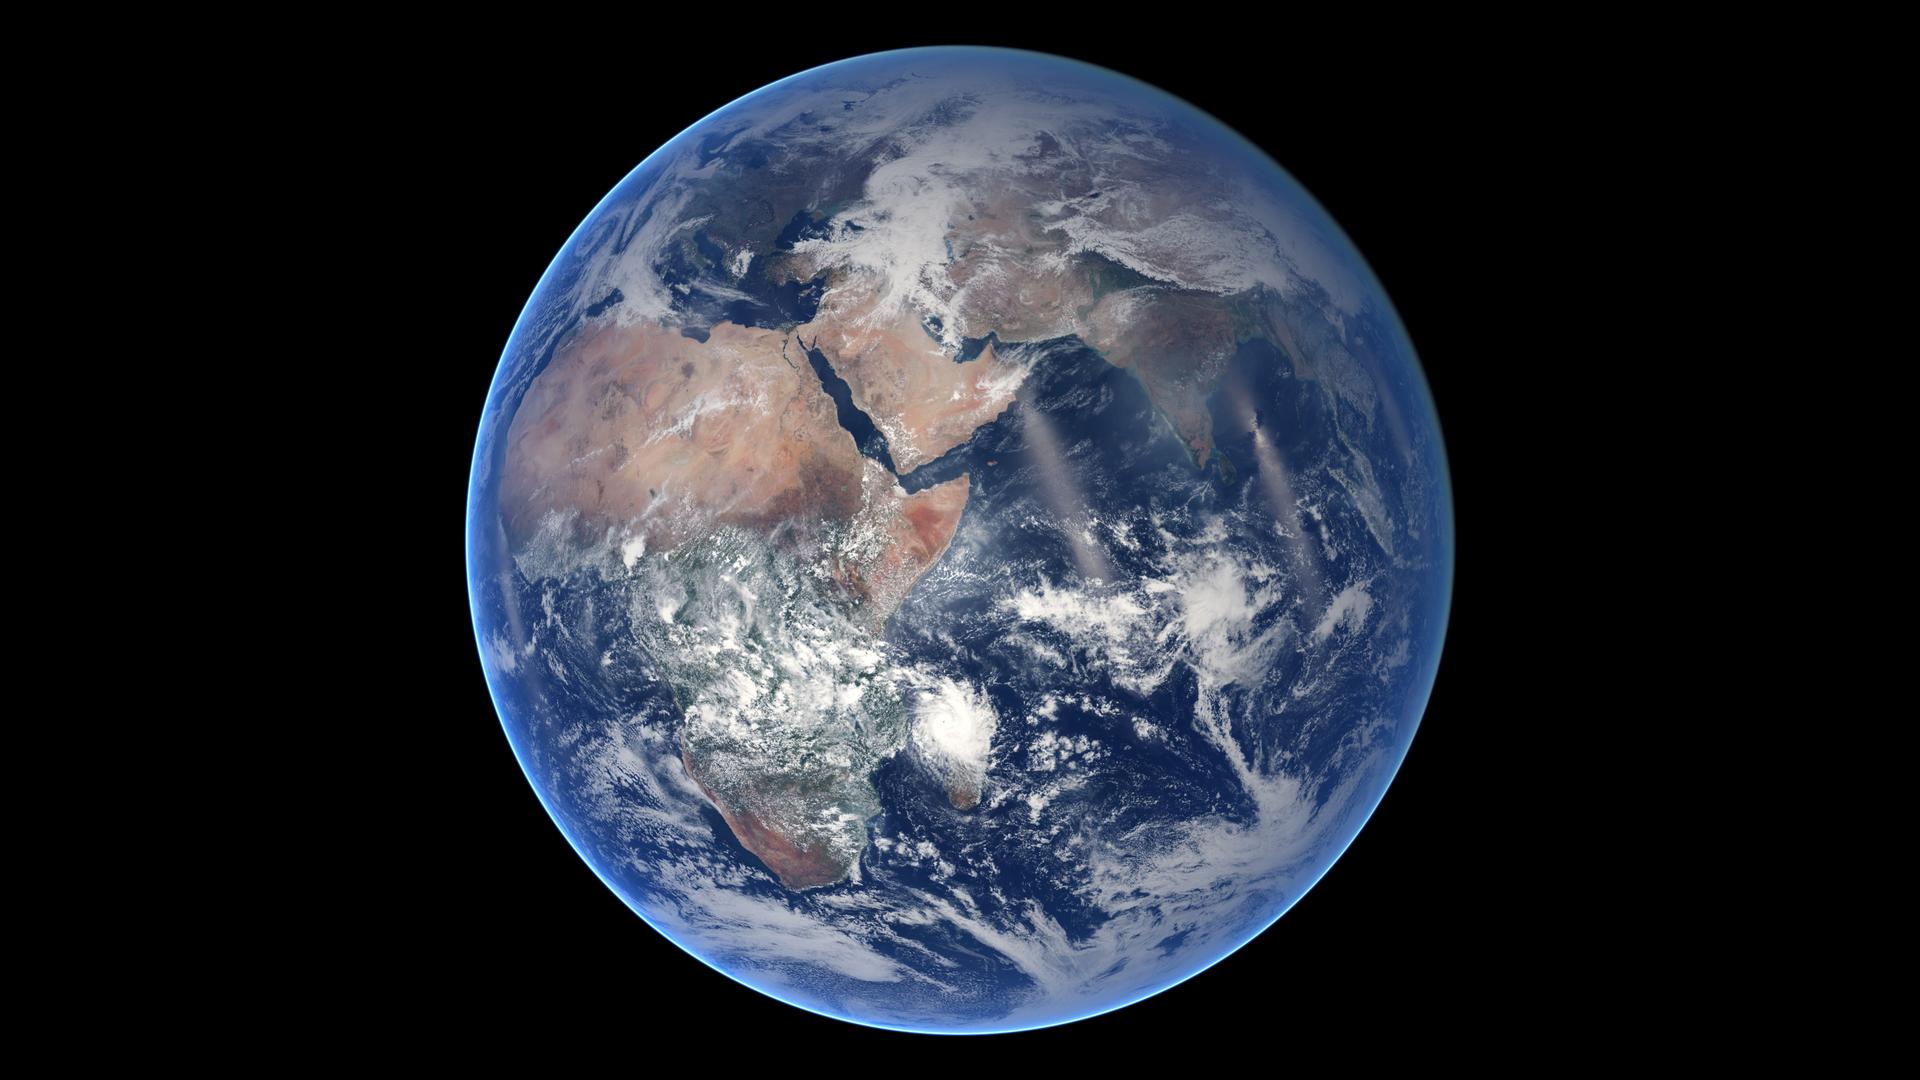
You Are Here Poster
Earth is more than a planet. Earth is home. As humans we are part of a broader, interconnected system and we share our home with over 8.5 million species. NASA studies our own planet more than any other. We observe Earth’s oceans, land, ice, and atmosphere, and measure how a change in one drives change in others
Download Here


How Do We Know Climate Change is Real?
There is unequivocal evidence that Earth is warming at an unprecedented rate. Human activity is the principal cause.
Earth-orbiting satellites and new technologies have helped scientists see the big picture, collecting many different types of information about our planet and its climate all over the world. These data, collected over many years, reveal the signs and patterns of a changing climate.
Read More
What is causing climate change?
Human activities are driving the global warming trend observed since the mid-20th century.
Scientists attribute the global warming trend observed since the mid-20th century to the human expansion of the "greenhouse effect" — warming that results when the atmosphere traps heat radiating from Earth toward space.
Over the last century, burning of fossil fuels like coal and oil has increased the concentration of atmospheric carbon dioxide (CO2). This increase happens because the coal or oil burning process combines carbon with oxygen in the air to make CO2.

What are the effects of climate change?
The effects of human-caused global warming are happening now, are irreversible for people alive today, and will worsen as long as humans add greenhouse gases to the atmosphere.
We already see effects scientists predicted, such as the loss of sea ice, melting glaciers and ice sheets, sea level rise, and more intense heat waves.
Scientists predict global temperature increases from human-made greenhouse gases will continue. Severe weather damage will also increase and intensify.


Climate Data Resources

Sea Level Change Observations from Space
Established in 2014, this NASA-sponsored team works to improve the understanding of regional relative sea-level change on a range of timescales. They work with partners to translate the latest science and research into actionable information and to communicate how impacts are increasing at the coast.

NASA Center for Climate Simulation (NCCS)
NCCS provides high performance computing for NASA-sponsored scientists and engineers. The purpose is to enhance NASA capabilities in Earth science, with an emphasis on weather and climate prediction, and to enable future scientific discoveries that will benefit humankind.

GISS Surface Temperature Analysis (GISTEMP)
NASA’s Goddard Institute of Space Studies assembles one of the world's most trusted global temperature records, using a combination of surface air temperature data acquired by tens of thousands of meteorological stations, as well as sea surface temperature data from ship- and buoy-based instruments.

Global Modeling and Assimilation Office (GMAO)
GMAO members perform research, develop models and assimilation systems, and produce quasi-operational products in support of NASA's missions. The Goddard Earth Observing System" (GEOS) family of models is used for applications across a wide range of spatial scales, from kilometers to many tens of kilometers.
World of Change
NASA Earth Observatory has produced a collection of image series that show some features of Earth that have changed over time due to both natural and human-induced causes.
Learn More