News | January 22, 2010
2009: Second warmest year on record; end of warmest decade

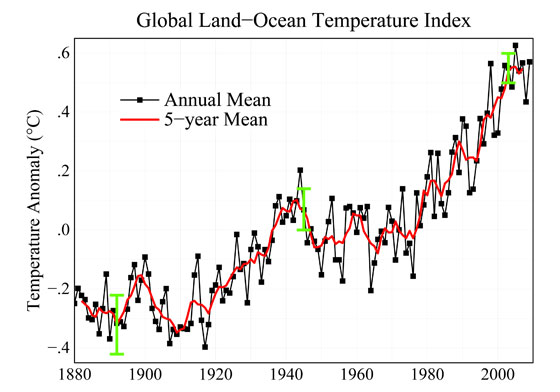
Except for a leveling off between the 1940s and 1970s, the surface temperature of our planet has increased since 1880. The last decade has seen global temperatures rise to the highest levels ever recorded. This graph illustrates the change in global surface temperature relative to 1951-1980 average temperatures. As shown by the red line, long-term trends are more apparent when temperatures are averaged over a 5-year period. The green error bars represent the uncertainty on measurements.
NASA
By Adam Voiland,
NASA’s Earth Science News Team
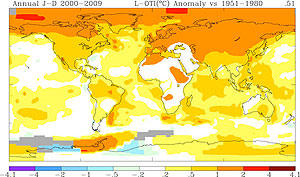
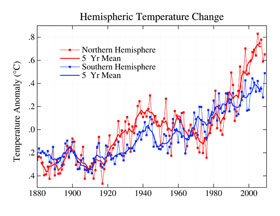
2009 was tied for the second warmest year in the modern record, a new NASA analysis of global surface temperature shows. The analysis, conducted by NASA's Goddard Institute for Space Studies (GISS) in New York City, also shows that in the Southern Hemisphere, 2009 was the warmest year since modern records began in 1880.
Although 2008 was the coolest year of the decade — due to strong cooling of the tropical Pacific Ocean — 2009 saw a return to near-record global temperatures. The past year was only a fraction of a degree cooler than 2005, the hottest year on record, and tied with a cluster of other years — 1998, 2002, 2003, 2006 and 2007 — as the second warmest year since recordkeeping began.
“There’s always an interest in the annual temperature numbers and on a given year’s ranking, but usually that misses the point,” said James Hansen, the director of GISS. “There's substantial year-to-year variability of global temperature caused by the tropical El Niño-La Niña cycle. But when we average temperature over five or ten years to minimize that variability, we find that global warming is continuing unabated."
The hottest decade
January 2000 to December 2009 was the warmest decade on record. Throughout the last three decades, the GISS surface temperature record shows an upward trend of about 0.2°C (0.4°F) per decade. Since 1880 — the year that modern scientific instrumentation became available to monitor temperatures precisely — a clear warming trend is present, though there was a leveling off between the 1940s and 1970s.

The near-record temperatures of 2009 occurred despite an unseasonably cool December in much of North America. High air pressures in the Arctic decreased the east-west flow of the jet stream (a fast flowing air current in the troposphere), while also increasing its tendency to blow from north to south and drag cold air southward from the Arctic. This resulted in an unusual effect that caused frigid air from the Arctic to rush into North America and warmer mid-latitude air to shift toward the north.
"Of course, the contiguous 48 states cover only 1.5 percent of the world area, so the U.S. temperature does not affect the global temperature much,' said Hansen.
In total, average global temperatures have increased by about 0.8°C (1.4°F) since 1880. “That’s the important number to keep in mind,” said Gavin Schmidt, another GISS climate researcher. “In contrast, the difference between, say, the second and sixth warmest years is trivial since the known uncertainty — or noise — in the temperature measurement is larger than some of the differences between the warmest years."
Decoding the temperature record
Climate scientists agree that rising levels of carbon dioxide and other greenhouse gases trap incoming heat near the surface of the Earth and are the key factors causing the rise in temperatures since 1880. But these gases are not the only factors that can impact global temperatures.
Three others key factors — changes in the sun’s irradiance (energy), changes in sea surface temperature in the tropics, and variations in aerosol levels in the atmosphere — can also cause slight increases or decreases in the planet's temperature. Overall, the evidence suggests that these effects are not enough to account for the global warming observed since 1880.
El Niño and La Niña are prime examples of how the oceans can affect global temperatures. They describe abnormally warm or cool sea surface temperatures in the South Pacific that are caused by changing ocean currents.
Global temperatures tend to decrease in the wake of La Niña, which occurs when upwelling cold water off the coast of Peru spreads westward in the equatorial Pacific Ocean. La Niña, which moderates the impact of greenhouse-gas driven warming, lingered during the early months of 2009 and gave way to the beginning of an El Niño phase in October that’s expected to continue in 2010.
An especially powerful El Niño cycle in 1998 is thought to have contributed to the unusually high temperatures that year, and Hansen’s group estimates that there’s a good chance 2010 will be the warmest year on record if the current El Niño persists. At most, scientists estimate that El Niño and La Niña can cause global temperatures to deviate by about 0.2°C (0.4°F).
Warmer surface temperatures also tend to occur during particularly active parts of the solar cycle, known as "solar maximums", while slightly cooler temperatures occur during lulls in activity, called "solar minimums".
A deep solar minimum has made sunspots a rarity in the last few years. Such lulls in solar activity, which can cause the total amount of energy given off by the sun to decrease by about a tenth of a percent, typically spur surface temperature to dip slightly. Overall, solar minimums and maximums are thought to produce no more than 0.1°C (0.2°F) of cooling or warming. As Hansen explained, “In 2009, it was clear that even the deepest solar minimum in the period of satellite data hasn’t stopped global warming from continuing.”

Small particles in the atmosphere called aerosols can also affect the climate. Volcanoes are powerful sources of sulfate aerosols that counteract global warming by reflecting incoming solar radiation back into space. In the past, large eruptions at Mount Pinatubo in the Philippines and El Chichón in Mexico have caused global dips in surface temperature of as much as 0.3°C (0.5°F). But volcanic eruptions in 2009 have not had a significant impact.
Meanwhile, other types of aerosols, often produced by burning fossil fuels, can change surface temperatures by either reflecting or absorbing incoming sunlight. Hansen’s group estimates that aerosols probably counteract about half of the warming produced by man-made greenhouse gases, but he cautions that better measurements of these elusive particles are needed.
Data details
To conduct its analysis, GISS uses publicly available data from three sources: weather data from more than a thousand meteorological stations around the world; satellite observations of sea surface temperature; and Antarctic research station measurements. These three datasets are loaded into a computer program, which is available for public download from the GISS website. The program calculates trends in terms of "temperature anomalies" — not absolute temperatures, but changes up or down relative to the average temperature for the same month during the period of 1951-1980.
Other research groups also track global temperature trends but use different analysis techniques. The Met Office Hadley Centre, based in the United Kingdom, uses similar input measurements as GISS, for example, but it omits large areas of the Arctic and Antarctic, where monitoring stations are sparse.
In contrast, the GISS analysis extrapolates data in those regions using information from the nearest available monitoring stations, and thus has more complete coverage of the Earth’s polar areas. If GISS didn't extrapolate in this manner, Schmidt explained, the computer software that performs the analysis would assume that areas without monitoring stations warm at the same rate as the global mean — an assumption that doesn't line up with the changes in Arctic sea ice that satellites have observed. Although the two methods produce slightly different results in the annual rankings, the decade-long trends in the two records are essentially identical.
"There's a contradiction between the results shown here and popular perceptions about climate trends," Hansen said. "In the last decade, global warming has not stopped."
Related Links:
- Video: Global Temperature Update 2009
- Q&A: Just 5 Questions: The Temperature Record
- News release: NASA Research Finds Last Decade was Warmest on Record, 2009 One of Warmest Years
- Dr. James Hansen Biography
- NASA GISS Surface Temperature Analysis Website
- Annual Temperature Data for 2008
- Raw Station Data
- NASA GISS Surface Temperature Analysis Software Source Code and Documentation
- List of NASA GISS Surface Temperature Analysis References
