News | August 22, 2011
Bump in the road
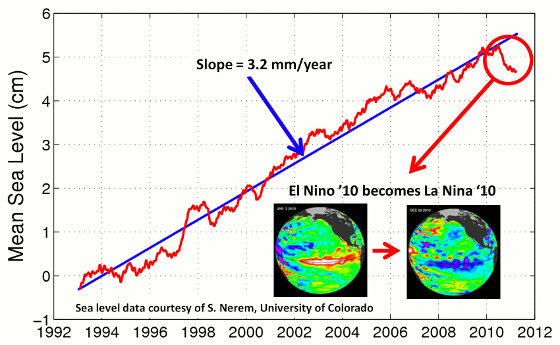
The red line in this image shows the long-term increase in global sea level since satellite altimeters began measuring it in the early 1990s. Since then, sea level has risen by a little more than an inch each decade, or about 3 millimeters per year. While most years have recorded a rise in global sea level, the recent drop of nearly a quarter of an inch, or half a centimeter, is attributable to the switch from El Niño to La Niña conditions in the Pacific. The insets show sea level changes in the Pacific Ocean caused by the recent El Niño and La Niña (see https://sealevel.jpl.nasa.gov/science/elninopdo/ for more information on these images). Image credit: S. Nerem, University of Colorado
› Larger image
By Alan Buis
NASA Jet Propulsion Laboratory
Like mercury in a thermometer, ocean waters expand as they warm. This, along with melting glaciers and ice sheets in Greenland and Antarctica, drives sea levels higher over the long term. For the past 18 years, the U.S./French Jason-1, Jason-2 and Topex/Poseidon spacecraft have been monitoring the gradual rise of the world's ocean in response to global warming.
While the rise of the global ocean has been remarkably steady for most of this time, every once in a while, sea level rise hits a speed bump. This past year, it's been more like a pothole: between last summer and this one, global sea level actually fell by about a quarter of an inch, or half a centimeter.
So what's up with the down seas, and what does it mean? Climate scientist Josh Willis of NASA's Jet Propulsion Laboratory, Pasadena, Calif., says you can blame it on the cycle of El Niño and La Niña in the Pacific.
Willis said that while 2010 began with a sizable El Niño, by year's end, it was replaced by one of the strongest La Niñas in recent memory. This sudden shift in the Pacific changed rainfall patterns all across the globe, bringing massive floods to places like Australia and the Amazon basin, and drought to the southern United States.
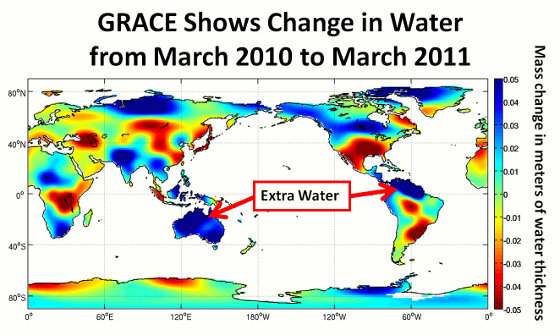
Data from the NASA/German Aerospace Center's twin Gravity Recovery and Climate Experiment (Grace) spacecraft provide a clear picture of how this extra rain piled onto the continents in the early parts of 2011. "By detecting where water is on the continents, Grace shows us how water moves around the planet," says Steve Nerem, a sea level scientist at the University of Colorado in Boulder.
So where does all that extra water in Brazil and Australia come from? You guessed it — the ocean. Each year, huge amounts of water are evaporated from the ocean. While most of it falls right back into the ocean as rain, some of it falls over land. "This year, the continents got an extra dose of rain, so much so that global sea levels actually fell over most of the last year," says Carmen Boening, a JPL oceanographer and climate scientist. Boening and colleagues presented these results recently at the annual Grace Science Team Meeting in Austin, Texas.
But for those who might argue that these data show us entering a long-term period of decline in global sea level, Willis cautions that sea level drops such as this one cannot last, and over the long-run, the trend remains solidly up. Water flows downhill, and the extra rain will eventually find its way back to the sea. When it does, global sea level will rise again.
"We're heating up the planet, and in the end that means more sea level rise," says Willis. "But El Niño and La Niña always take us on a rainfall rollercoaster, and in years like this they give us sea-level whiplash.