News | August 19, 2013
Heat wave in China
NASA Earth Observatory images by Jesse Allen, using Landsat data from the U.S. Geological Survey and Terra MODIS data from the Land Processes Distributed Active Archive Center. Caption by Holli Riebeek.
For the entire month of July and the first half of August, eastern China baked in a record-breaking heat wave. Nineteen provinces endured above-normal temperatures. Shanghai broke its all-time record high three times in as many weeks. The current record—40.8 degrees Celsius (105.4°F)—was set on August 7, 2013. At least 40 people have died during the heat wave, including ten in Shanghai, according to the Xinhua news service.
During a heat wave, ground temperatures soar, particularly in urban areas where there are fewer plants to cool the ground with shade and evapotranspiration. Paved or metallic surfaces can become warm enough to cook food. These images show land surface temperatures as measured by two different satellites.
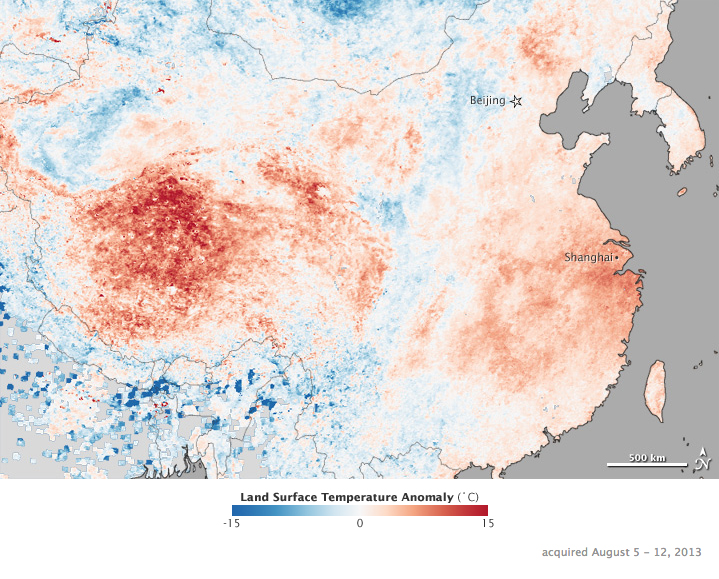
The image above shows temperature anomalies across China between August 5 and August 12, 2013, as observed by the Moderate Resolution Imaging Spectroradiometer (MODIS) on NASA’s Terra satellite. Red areas are warmer than the long-term average for the week, while cooler-than-average temperatures are blue. While much of China was warm during this period, the worst of the heat wave was concentrated near the coast and in Tibet. This weather pattern is tied to a subtropical high-pressure system parked over southern China, according to the China Meteorological Administration.
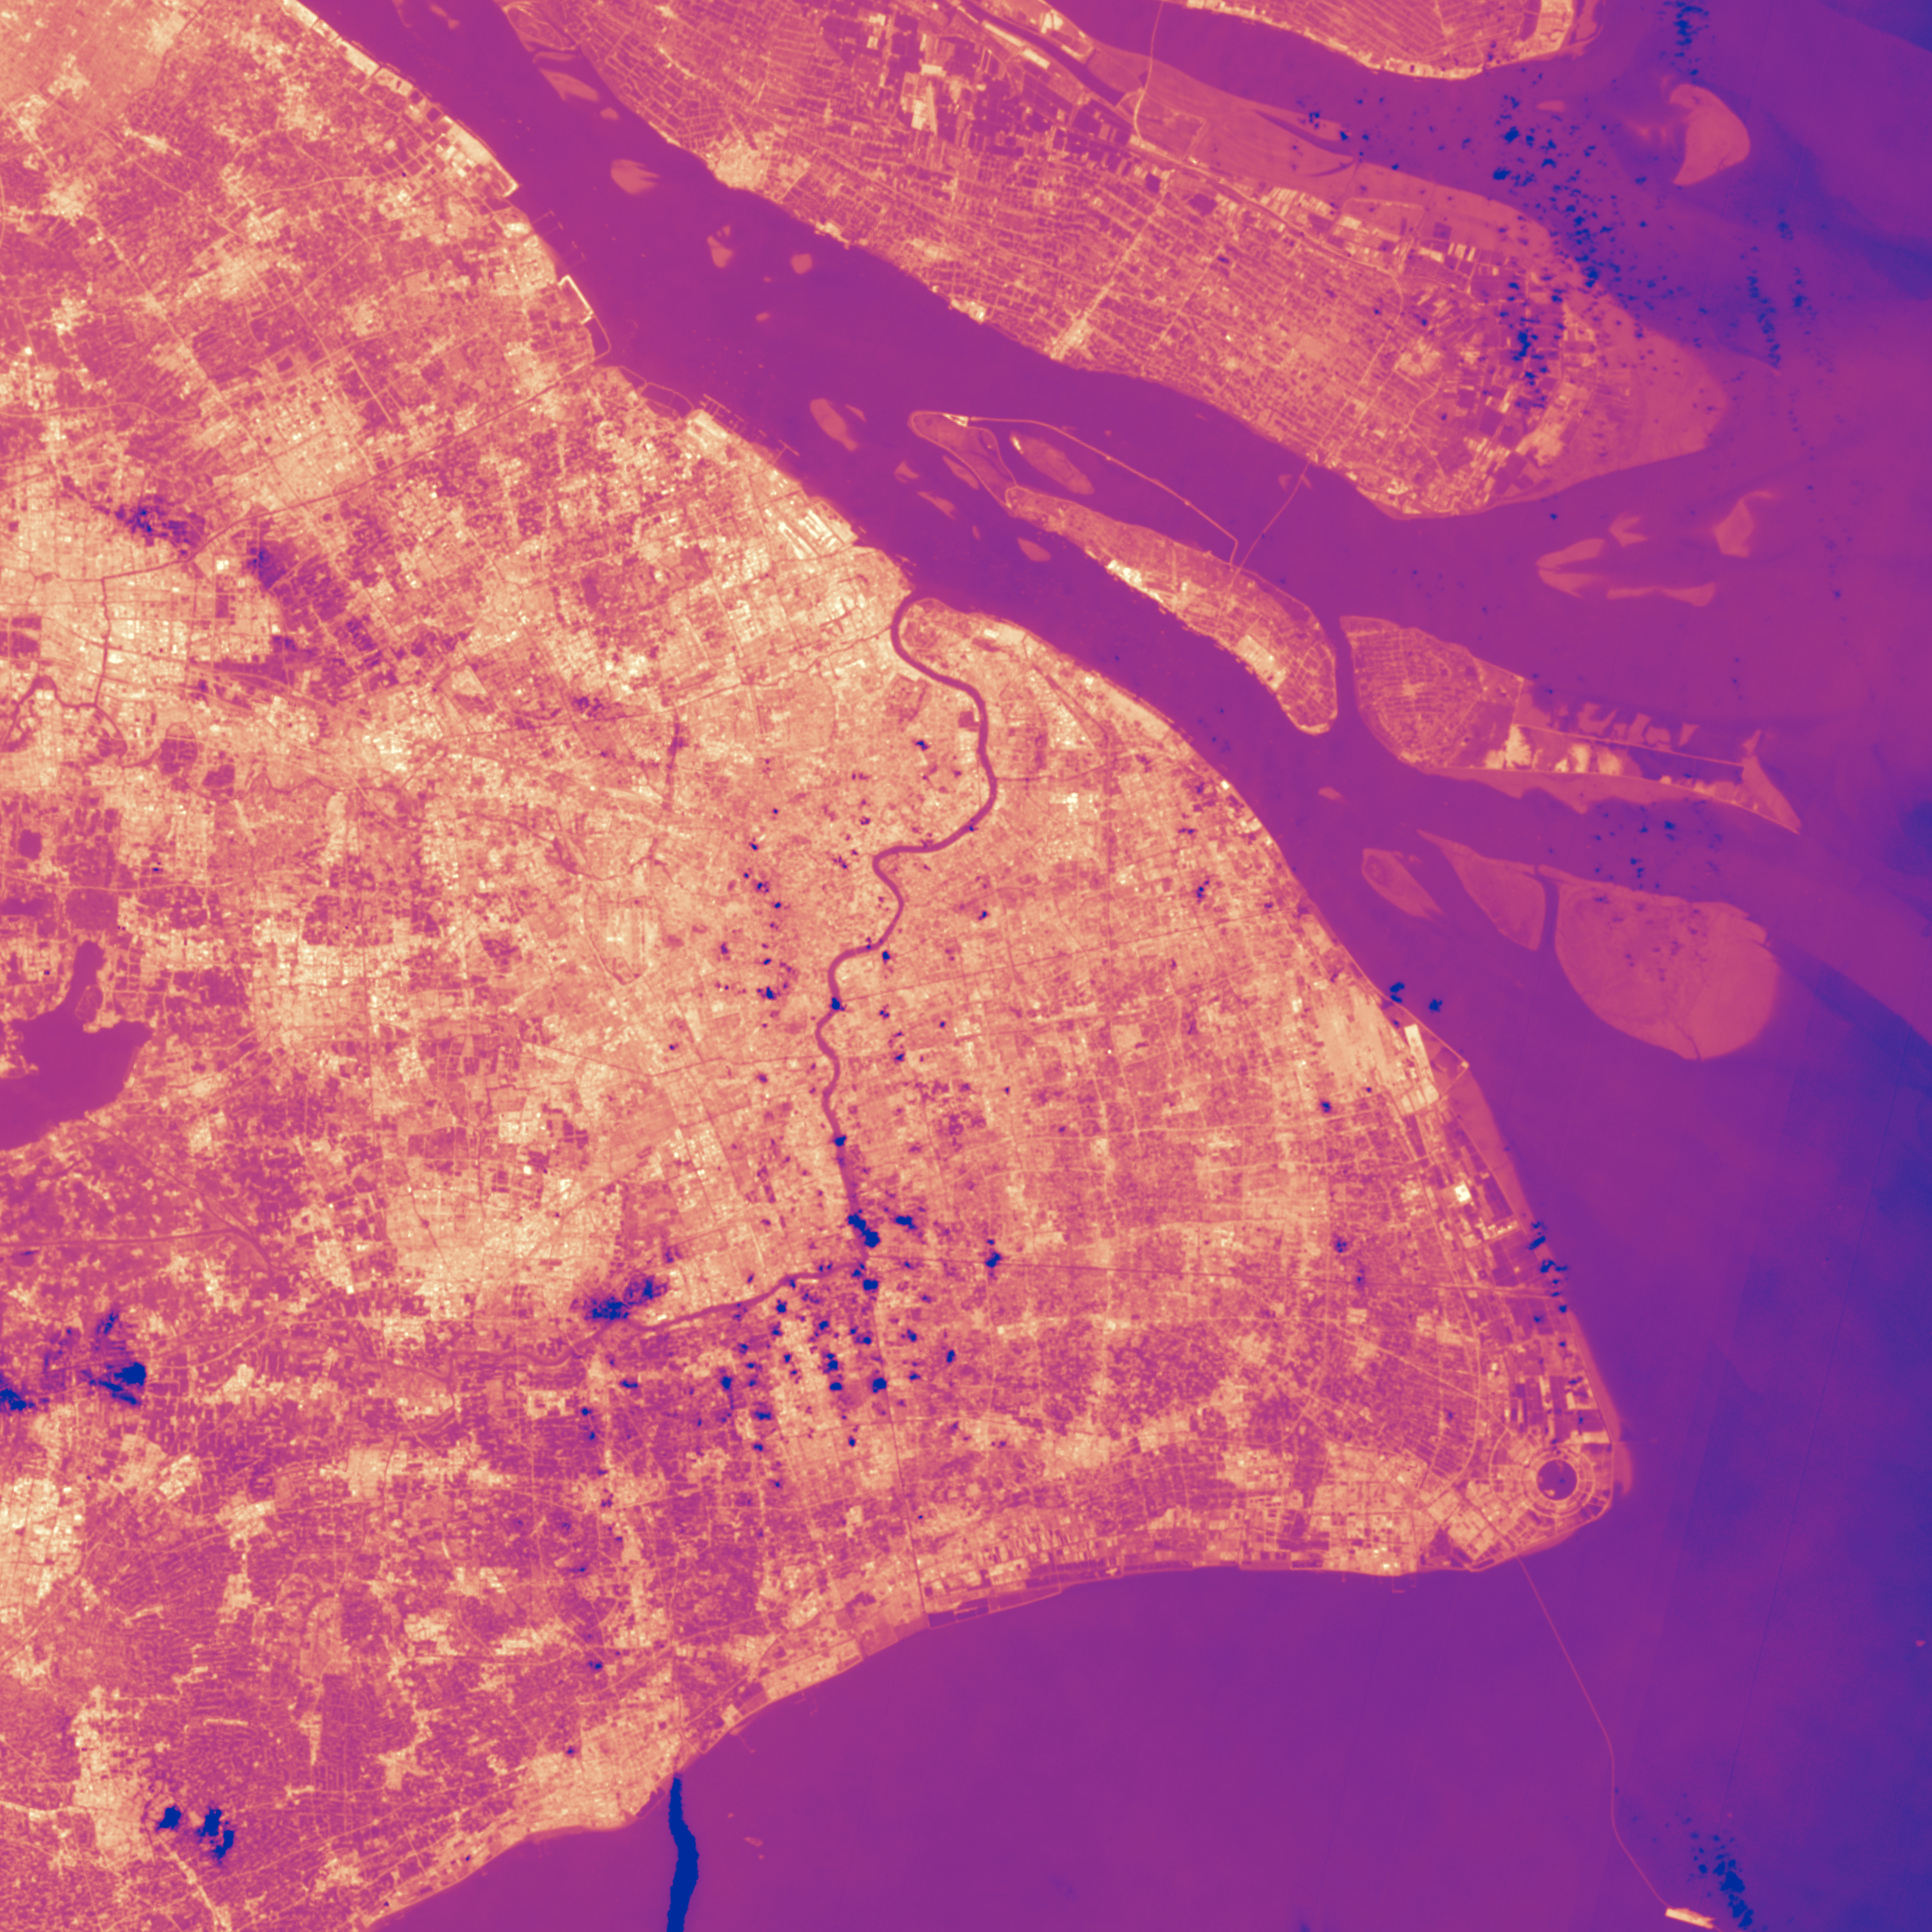
Though miserable everywhere, the heat wave was likely worst in China’s cities, where manmade surfaces absorb heat during the day and cool slowly at night. As a result, cities are warmer during the day and slower to cool at night, making an extended heat wave more uncomfortable, and more deadly, in a city. The image below shows this “urban heat island” effect in Shanghai.
Chinese officials have declared a weather emergency, warning residents to limit time outdoors. It is the first time the country has issued a weather warning for heat. China’s National Meteorological Center expected the heat to break sometime after August 15.


