News | May 11, 2009
Move any mountain
|
Understanding what happens to water in mountainous areas is a challenge. Often the topography of the land is complicated, the seasons bring big changes in water levels and datasets for mountainous regions are typically sparse. In these landscapes, water falls to the ground as snow and, in warmer climates, when spring arrives, snowpacks often thaw and melt, causing the melted water to flow overland as snowmelt.
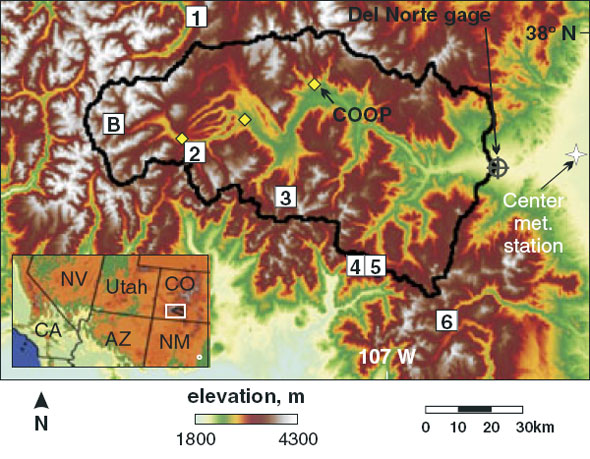
Snow cover is relatively easy to track using satellites that orbit Earth. But to piece together the water cycle in detail, scientists want to be able to measure snow water equivalent -- a quantity that describes the amount of water contained within the snowpack, or the depth of water that would be produced if the entire snowpack melted instantaneously -- over large areas and with high precision. Noah Molotch, a snow hydrologist at JPL, has combined data from NASA's Earth-observing satellites with a new mathematical snowmelt model to estimate snow water equivalent in the headwaters of the Rio Grande basin in Colorado's San Juan Mountains in the U.S. His technique can estimate the equivalent down to a scale of 100 meters (328 feet) over an area of 3,419 square kilometers (1,320 square miles) -- 10 times the area covered by previous snowmelt reconstruction techniques.
The Rio Grande basin ranges in height from 2,400 to 4,200 meters (7,900 to 13,800 feet). Sixty percent of the yearly precipitation is snow that falls during the winter months, with the snow persisting until May or July, depending on the elevation. Molotch's snowmelt model calculates the change in mass of the snowpack using three factors. First, the snow melting rate, which depends on solar radiation and air temperature. Second, the depletion rate of the snow-covered area, which is measured by NASA's Landsat-7 satellite and Moderate Resolution Imaging Spectroradiometer (MODIS) instrument on board the Terra satellite. These missions take photos of Earth's continents and coastal regions. Third, the maximum snow water equivalent that has built up at the start of the melting season is calculated by adding up all of the predicted snowmelt over the time it takes to melt the snow in a given 100-meter (328-foot) "pixel."
Using this approach, Molotch shows that it is possible to track snow mass at new accuracy levels and over large mountain regions without needing to rely on measurements taken on the ground -- a major advantage. According to his results, snow water equivalent in the Rio Grande can be estimated to within about 23 percent of the actual amount under a variety of climatic conditions. Ultimately, the technique could make it possible to measure snowmelt and its contribution to the global water cycle in real time.
| Research paper: |
|
| Related research: |
|
Amber Jenkins Global Climate Change Jet Propulsion Laboratory