6 min read
Global sea levels have been ticking steadily higher by about an eighth of an inch (3.2 millimeters) each year since scientists began measuring them two decades ago. That’s why Carmen Boening, a research scientist at NASA’s Jet Propulsion Laboratory in Pasadena, California, was so shocked in 2010 and 2011, when she saw a quarter-inch (five-millimeter) drop in sea level – a sudden reversal of the trend.
“We knew that either the sea was cooling, or there was less water in the ocean,” Boening said. Like metal, water contracts when it cools. “So we used NASA’s GRACE mission, which basically weighs water to tell us how much is present in different parts of the world, both in the ocean and on land. We found there was actually less water in the ocean.”
Water can’t just vanish. If it leaves the ocean, it has to show up somewhere else in the water cycle. Sure enough, Boening’s team found huge amounts of precipitation and flooding in Australia and South America. GRACE data suggested lots of water had evaporated from the ocean during the 2011 La Niña event. Then other wind patterns pushed the precipitation to Australia.
“It had to be a combination of all these events at once, and that’s why the drop was so large,” Boening said. “But at some point, it had to run off into the ocean. That’s what happened next.” A few months later, the ocean returned to the previous year’s levels and the upward trend resumed.
Global sea levels have risen by about 8 inches in the last 130 years. It might not sound like much – but the ocean covers about 70 percent of Earth’s surface and holds about 99 percent of its water. A tiny rise or fall involves a lot of water.
“Sea level rise is the yardstick for global warming,” said Josh Willis, a research scientist at JPL. “It’s the ruler by which we measure how much human activity has changed the climate. It’s the sum of the extra heat the ocean has absorbed and the water that’s melted off of glaciers and ice sheets.”
Willis leads NASA’s
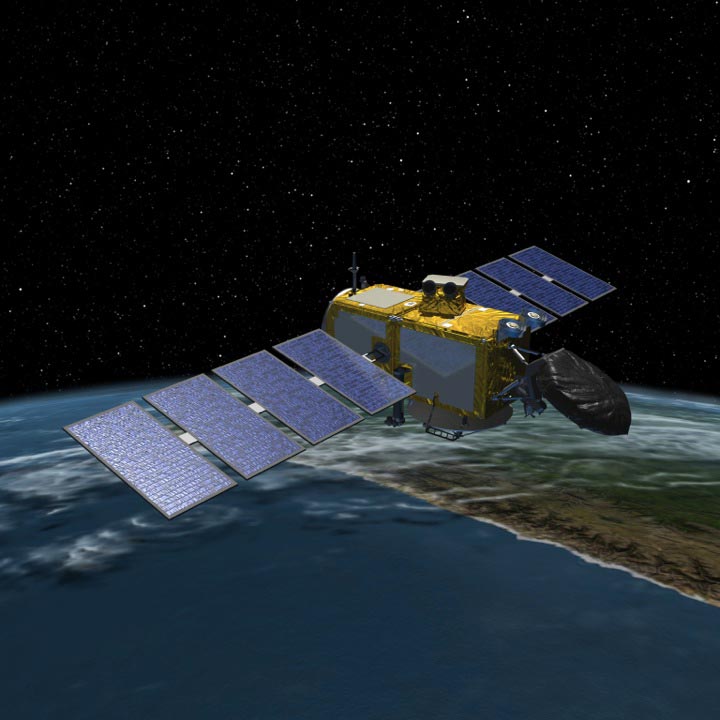
missions, satellites that measure sea level and ocean surface topography, or variations in ocean surface height at different areas around the globe. This variation is driven in part by deeper currents and weather patterns like El Niño, La Niña and the Pacific Decadal Oscillation. These patterns move huge amounts of water from some regions of the ocean to others, pushing some parts of the surface downward and others upward.
The Gravity Recovery and Climate Experiment (GRACE) mission, which helped Boening and Willis track water during the 2011 La Niña, collects data using twin satellites orbiting Earth together. When the lead satellite encounters a slight change in Earth’s gravity, the force pulls it a little further from its partner. The second satellite measures the distance between them to estimate the strength of Earth’s gravity.
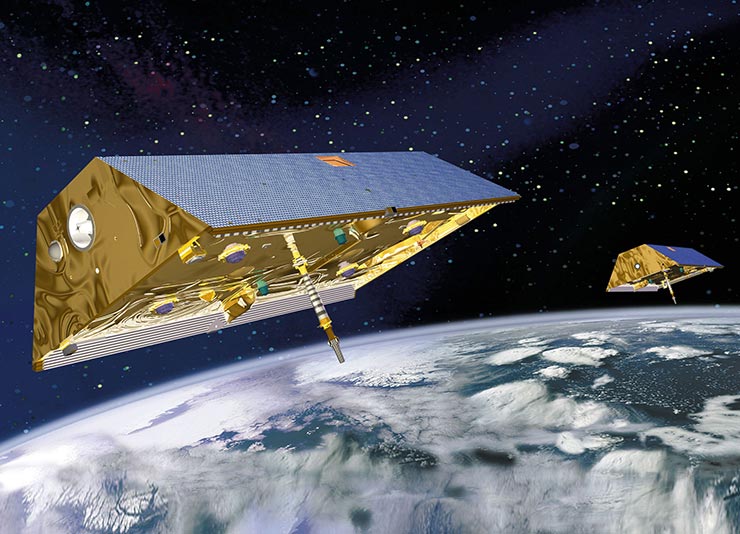
The planet’s gravity changes because different amounts of mass have piled up at different places. There’s a lot more Earth in the Himalaya, for example, than in the Mississippi Delta. Similarly, when water coalesces in a certain part of the ocean, it tugs on GRACE’s satellites a little harder.
But changes on land also play a role. For example, Greenland’s ice is melting. "As the land loses mass, its gravitational pull is not as strong, so it’s losing its ability to attract water,” Boening said. Though melting land ice from Greenland and glaciers account for about two-thirds of sea level rise to date, “sea level around Greenland is actually going down.”
The ocean is also gaining heat. Small heat transfers happen constantly at the ocean’s surface and, eventually, the ocean swallows most of the heat greenhouse gases have trapped in Earth’s atmosphere. That heat warms the whole ocean, causing it to expand.
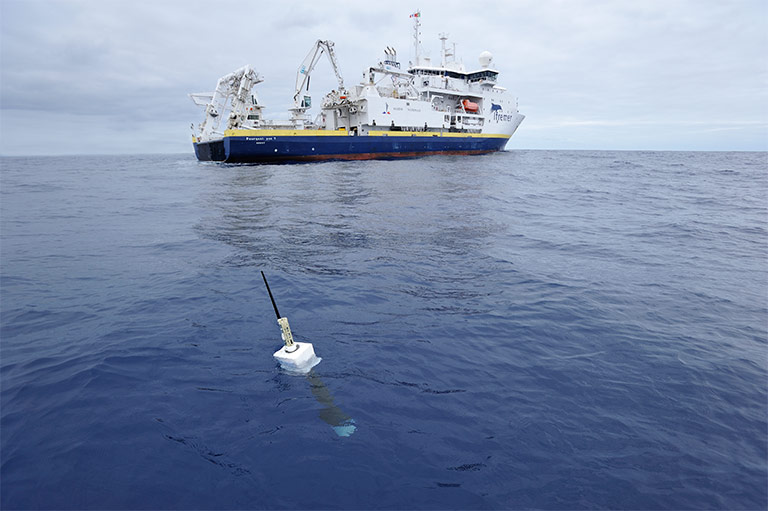
Expansion seems simple, but measuring it is a challenge. “Over 90 percent of the heat trapped inside Earth’s atmosphere by global warming is going into the oceans,” Willis said. Temperature data from 19th-century ship, compared to a set of 3,600 buoys measuring ocean temperature today, confirms that the ocean – especially its upper half – has warmed since 1870.
In the bottom half of the ocean, though, it’s harder to tell. Buoys measure only about halfway to the bottom, a depth of about 1.25 miles (2,000 meters). Over many decades, ocean currents pull water from the surface of the ocean toward its depths. Scientists have assumed the deep ocean has been warming, too – but a new paper by Willis and other JPL scientists found no detectable warming below that 1.25-mile (2,000-meter) mark since 2005.
“We can’t see heat in the deep ocean yet. The effect has been too small over our ten years of data, and the ways the ocean can get heat down deep are very slow. It might take a hundred years,” Willis said. “We still have to rely on the data and not our simulations to figure out what’s going on in the deep ocean. So we have some more scientific work to do.”
On the other hand, another paper from the same journal found that earlier studies drastically underestimated warming in the Southern Ocean, since the 1970s. New estimates suggest it absorbed anywhere from 25 to 58 percent more heat than previous researchers thought.
Scientists will continue learning more about the ocean’s intricacies, correcting assumptions and revising old estimates. But Willis warns against losing sight of the strong global trend toward rising sea levels.
“The picture is very simple,” he said. “The ocean heats up and causes sea level rise. Ice melts and causes sea level rise. We can see the results at the shoreline.”
This feature is part of a series exploring how NASA monitors Earth’s water cycle. Other ocean missions include Aquarius, which measures the ocean’s salinity to offer scientists clues about evaporation and rainfall patterns and changes in the ocean’s density, which can drive circulation patterns. The Surface Water and Ocean Topography (SWOT) mission will improve topography measurements at the coast after its 2020 launch. Learn more about all of NASA’s Earth science missions.


