News | December 1, 2014
West Antarctic melt rate has tripled
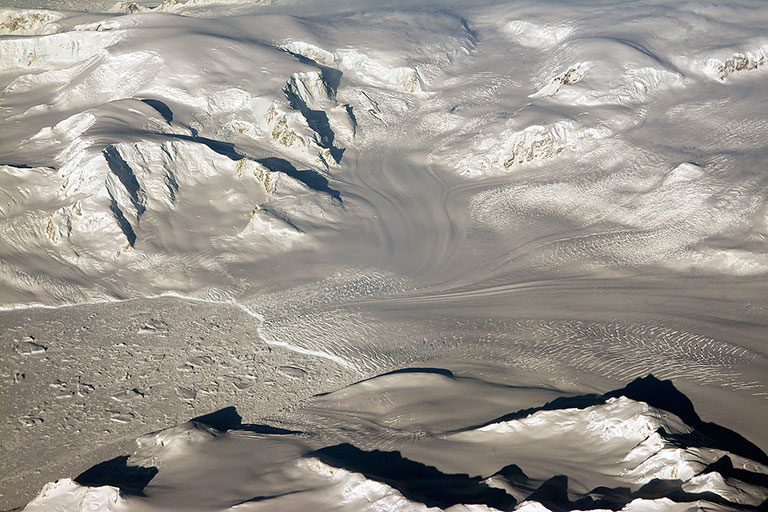
Glaciers seen during NASA's Operation IceBridge research flight to West Antarctica on Oct. 29, 2014. Credit: NASA/Michael Studinger. View larger image.
A comprehensive, 21-year analysis of the fastest-melting region of Antarctica has found that the melt rate of glaciers there has tripled during the last decade.
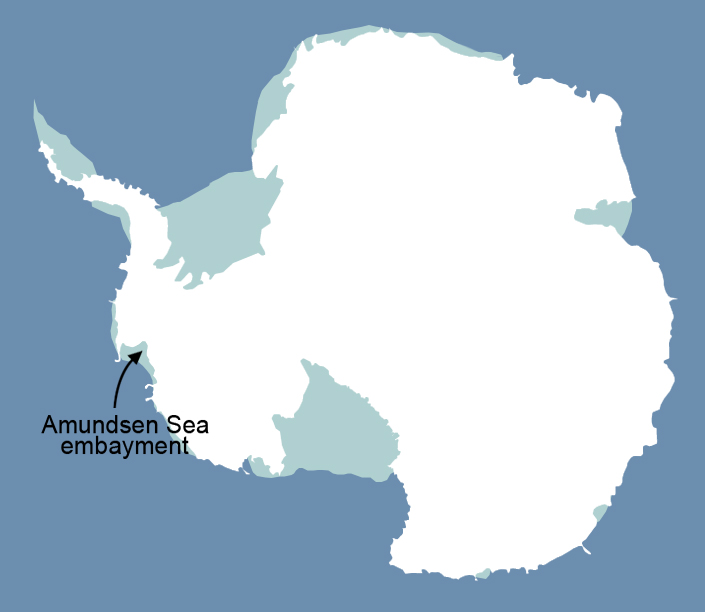
The glaciers in the Amundsen Sea Embayment in West Antarctica are hemorrhaging ice faster than any other part of Antarctica and are the most significant Antarctic contributors to sea level rise. This study by scientists at the University of California, Irvine (UCI), and NASA is the first to evaluate and reconcile observations from four different measurement techniques to produce an authoritative estimate of the amount and the rate of loss over the last two decades.
Lead author Tyler Sutterley, a doctoral candidate at UCI, and his team did the analysis to verify that the melting in this part of Antarctica is shifting into high gear. "Previous studies had suggested that this region is starting to change very dramatically since the 1990s, and we wanted to see how all the different techniques compared," Sutterley said. "The remarkable agreement among the techniques gave us confidence that we are getting this right."
The researchers reconciled measurements of the mass balance of glaciers flowing into the Amundsen Sea Embayment. Mass balance is a measure of how much ice the glaciers gain and lose over time from accumulating or melting snow, discharges of ice as icebergs, and other causes. Measurements from all four techniques were available from 2003 to 2009. Combined, the four data sets span the years 1992 to 2013.
The glaciers in the embayment lost mass throughout the entire period. The researchers calculated two separate quantities: the total amount of loss, and the changes in the rate of loss.
The total amount of loss averaged 83 gigatons per year (91.5 billion U.S. tons). By comparison, Mt. Everest weighs about 161 gigatons, meaning the Antarctic glaciers lost an amount of water weight equivalent to Mt. Everest every two years over the last 21 years.
The rate of loss accelerated an average of 6.1 gigatons (6.7 billion U.S. tons) per year since 1992.
During the period when the four observational techniques overlapped, the melt rate increased an average of 16.3 gigatons per year — almost three times the rate of increase for the full 21-year period. The total amount of loss was close to the average at 84 gigatons.
The four sets of observations include NASA's Gravity Recovery and Climate Experiment satellites, laser altimetry from NASA's Operation IceBridge airborne campaign and the earlier ICESat satellite, radar altimetry from the European Space Agency's Envisat satellite, and mass budget analyses using radars and the University of Utrecht’s Regional Atmospheric Climate Model.
The scientists noted that glacier and ice sheet behavior worldwide is by far the greatest uncertainty in predicting future sea level. "We have an excellent observing network now. It’s critical that we maintain this network to continue monitoring the changes," Velicogna said, "because the changes are proceeding very fast."


