


A graphic from NASA's Scientific Visualization Studio helps one view Arctic sea ice extent from a different perspective.

This grid contains 412 images of North Pole sea ice extent taken by the National Snow and Ice Data Center (NSIDC) in Bolder, Col., between 1979 and 2014 — a span of 35 years.
NASA’s Scientific Visualization Studio shrank the images to make a graphic that illustrates not only when Arctic sea ice extent is at its annual minimum and maximum, but also how sea ice has changed over the last three decades.
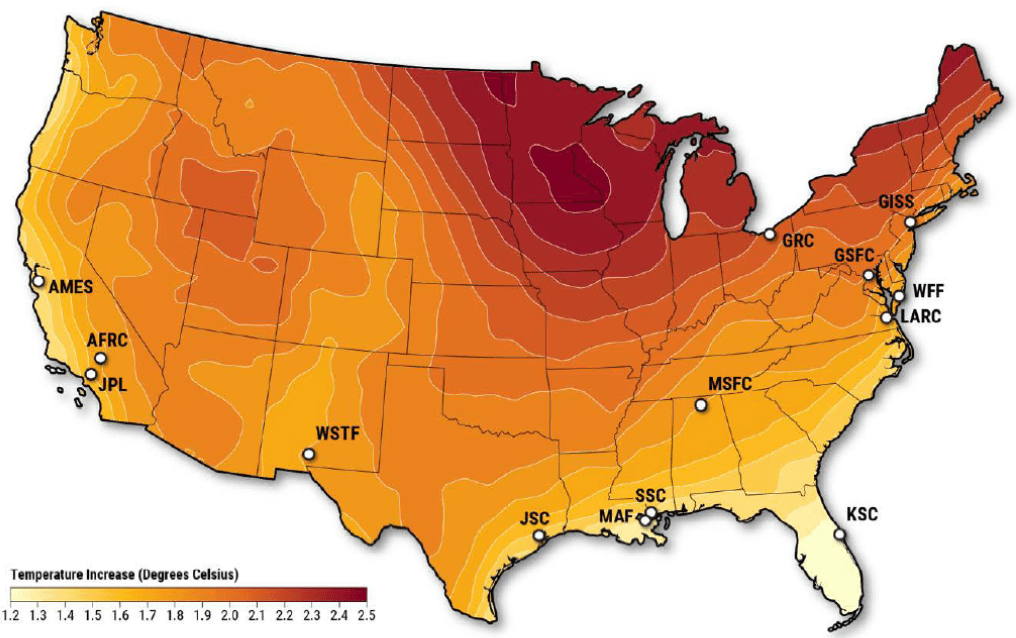
Data collected by satellite between 1981 and 2001 show that some Arctic regions are warming as quickly as 2.5 degrees Celsius per decade. September 2012 reached a low of 3.6 million square kilometers, almost half as much as the 1979 to 2000 mean of 7 million square kilometers.
Learn more: