Carbon Dioxide
Carbon dioxide (CO2) is an important heat-trapping gas, also known as a greenhouse gas, that comes from the extraction and burning of fossil fuels (such as coal, oil, and natural gas), from wildfires, and natural processes like volcanic eruptions. The first graph shows atmospheric CO2 levels measured by NOAA at Mauna Loa Observatory, Hawaii, since 1958. The second graph shows CO2 levels during Earth’s last three glacial cycles, as captured by air bubbles trapped in ice sheets and glaciers.
Since the onset of industrial times in the 18th century, human activities have raised atmospheric CO2 by 50% – meaning the amount of CO2 is now 150% of its value in 1750. This human-induced rise is greater than the natural increase observed at the end of the last ice age 20,000 years ago.
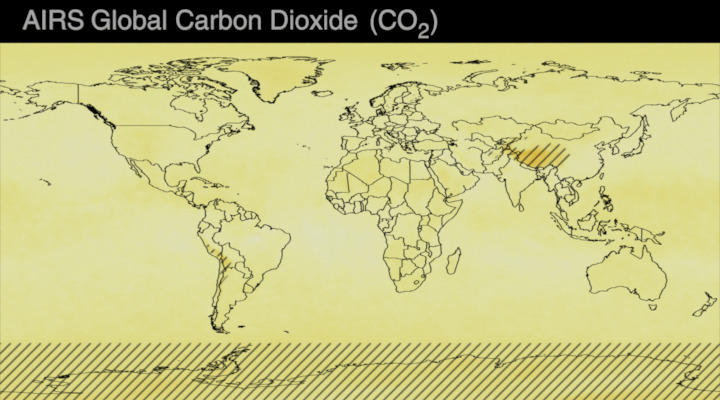
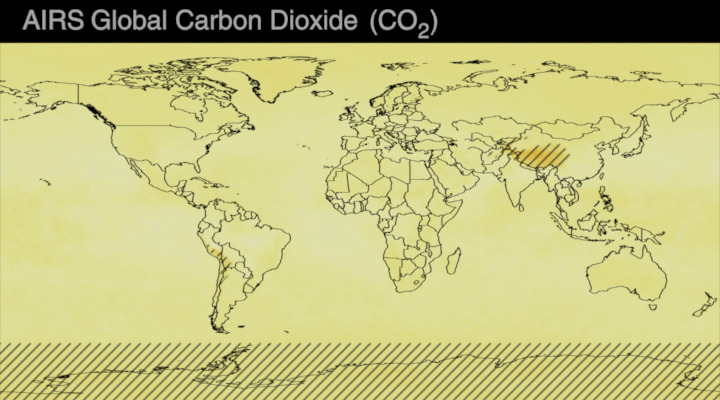
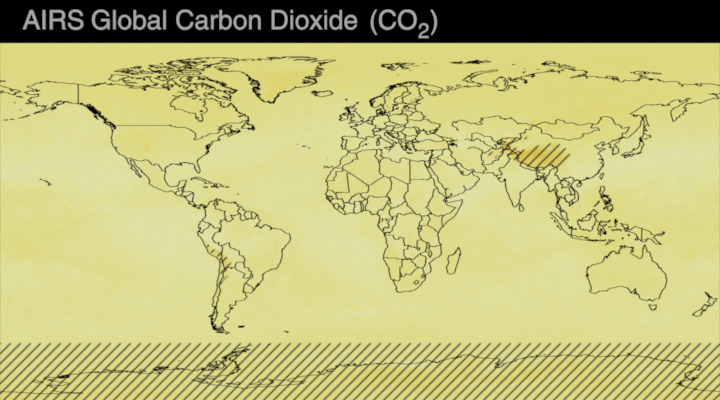
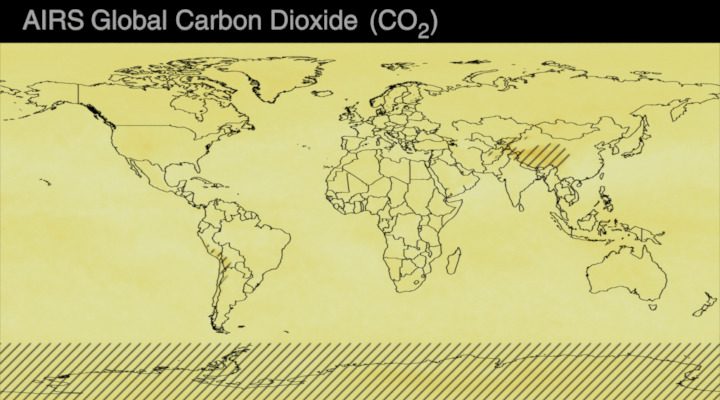
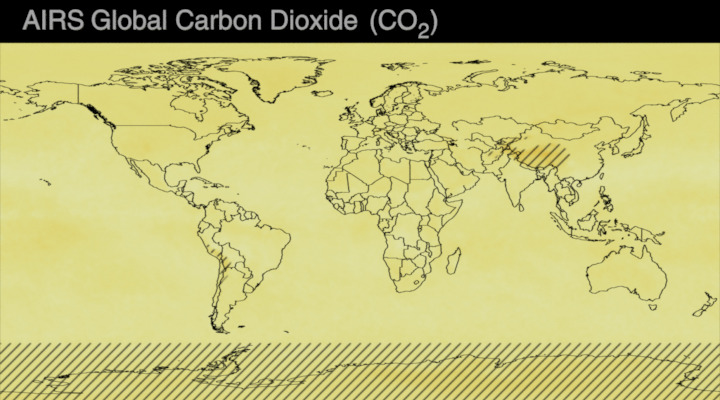
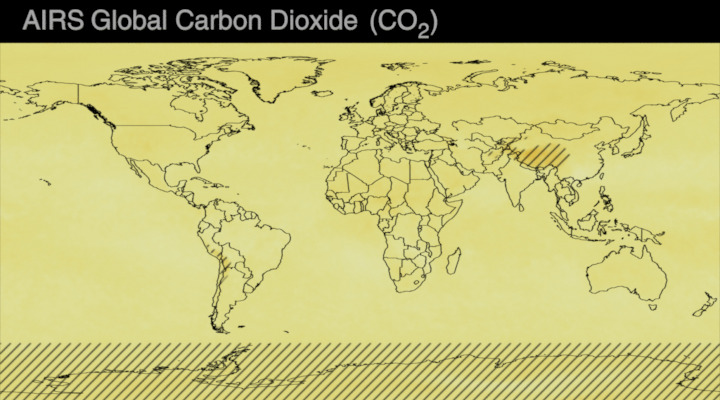
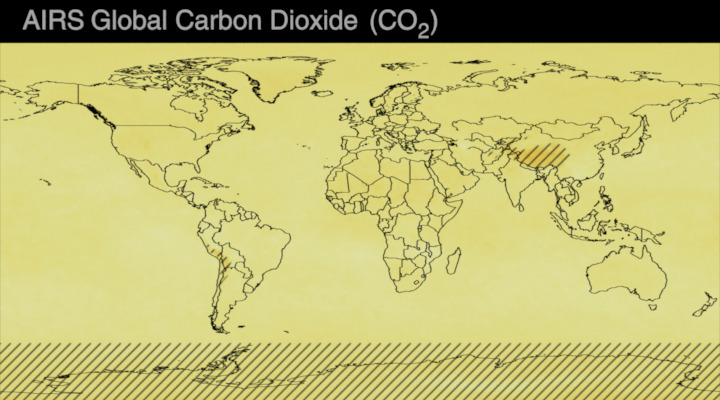
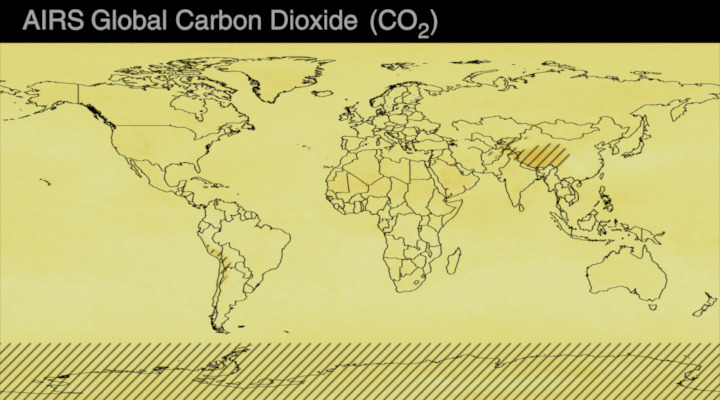
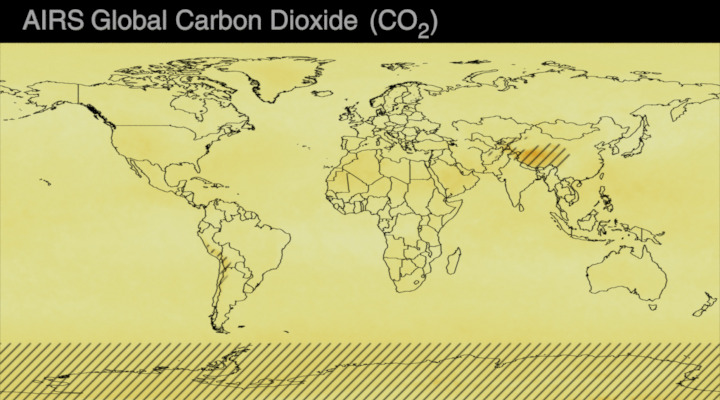
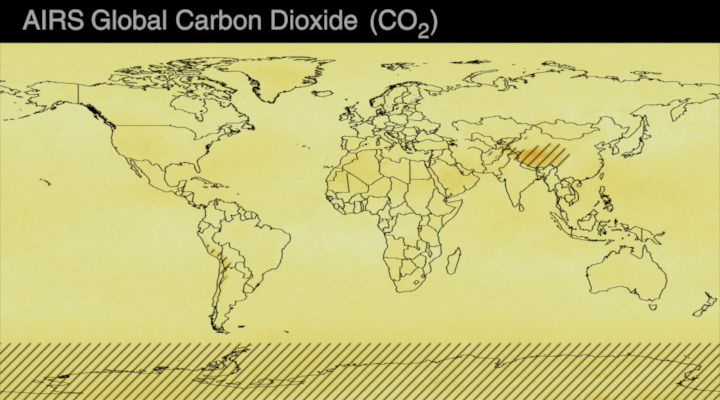
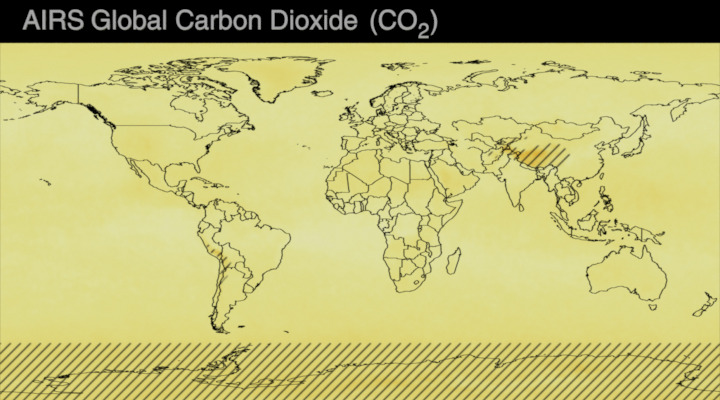
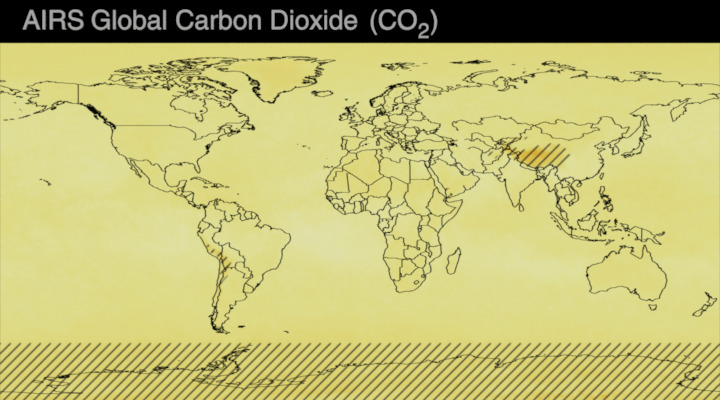
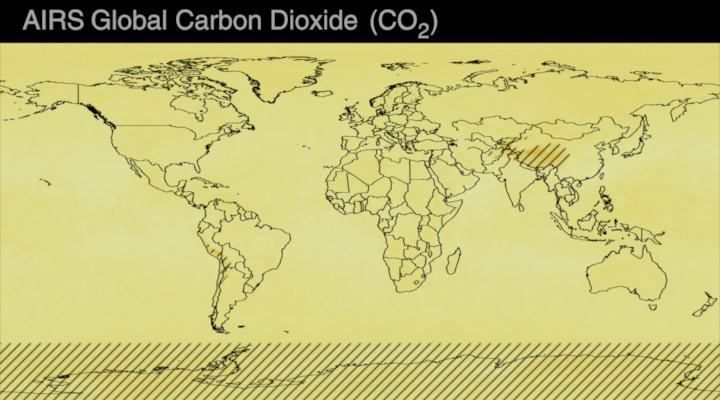
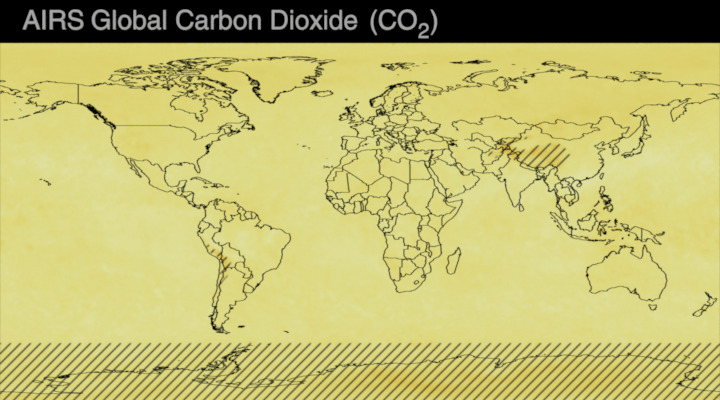
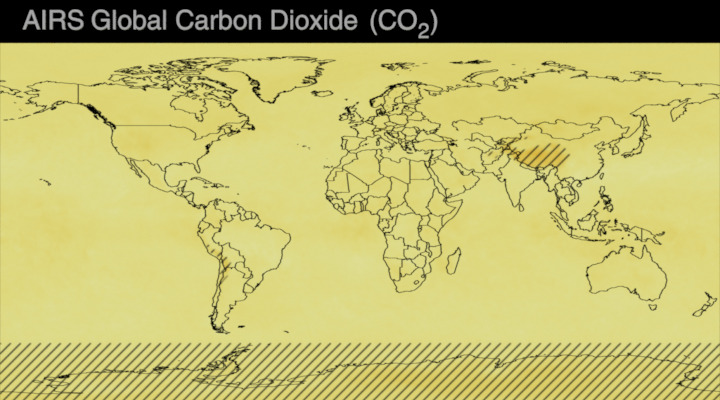
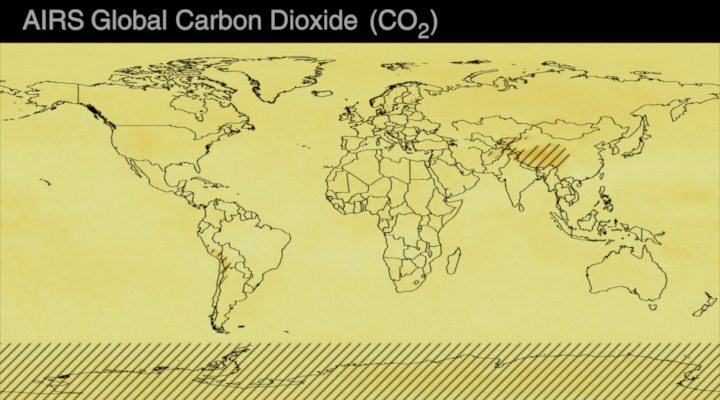
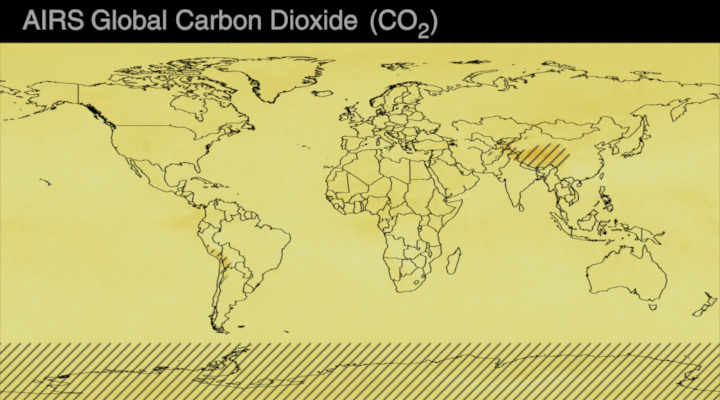
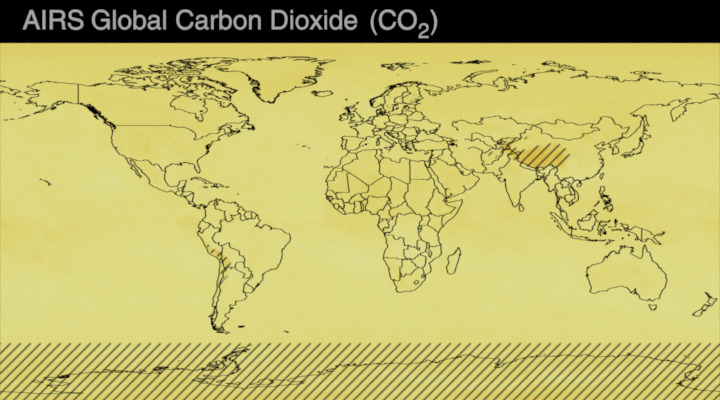
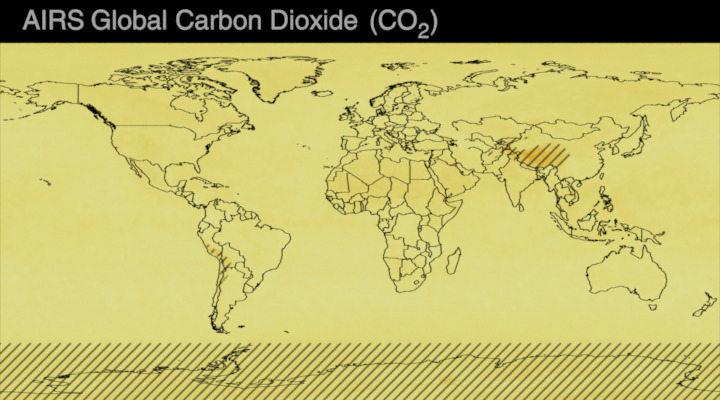
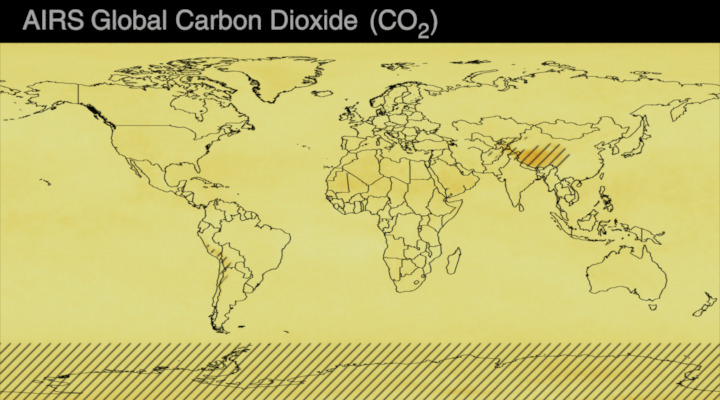
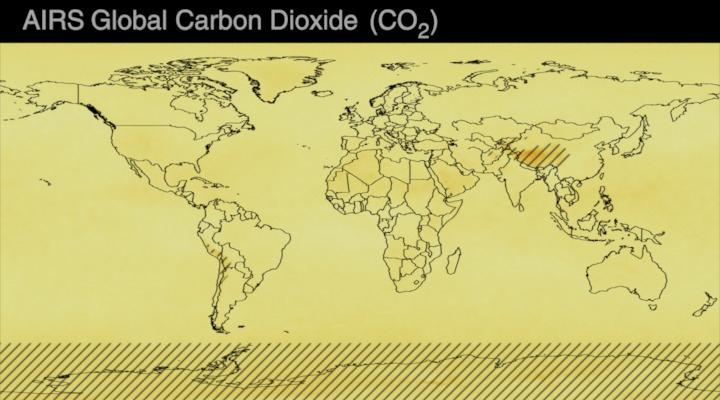
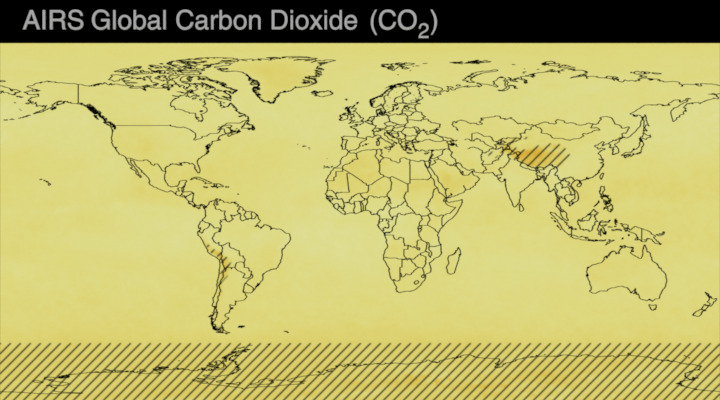
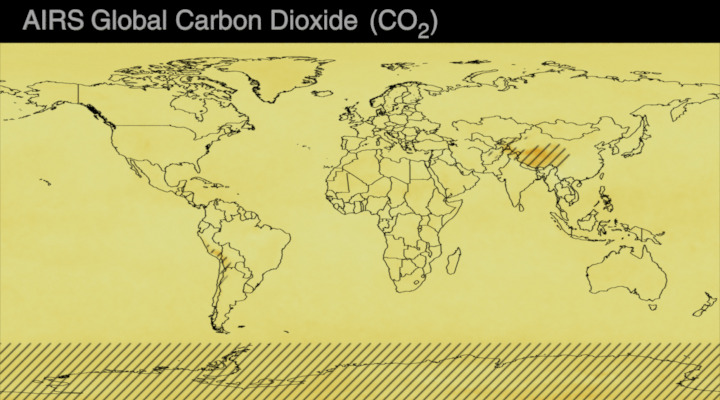
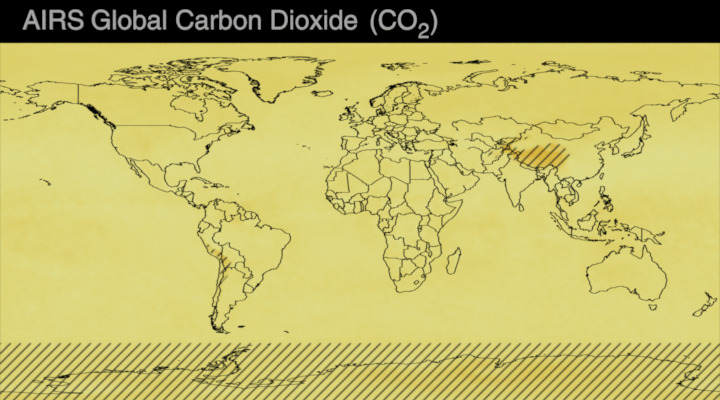
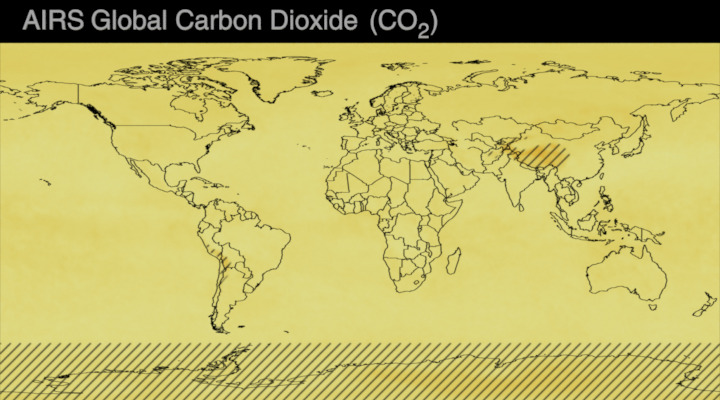
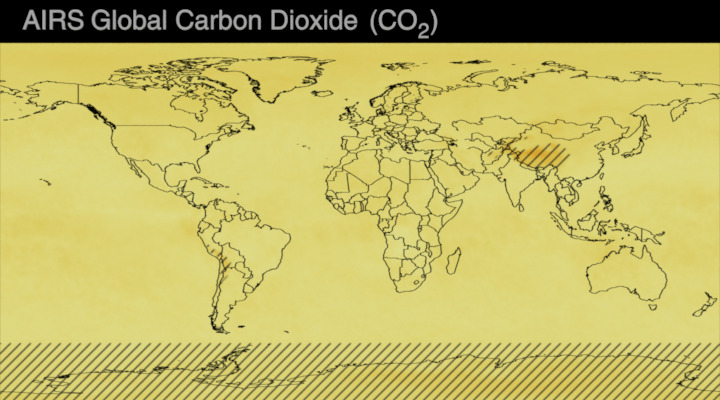
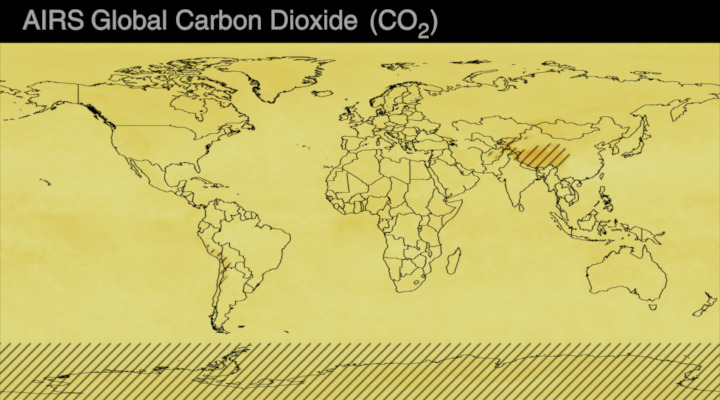
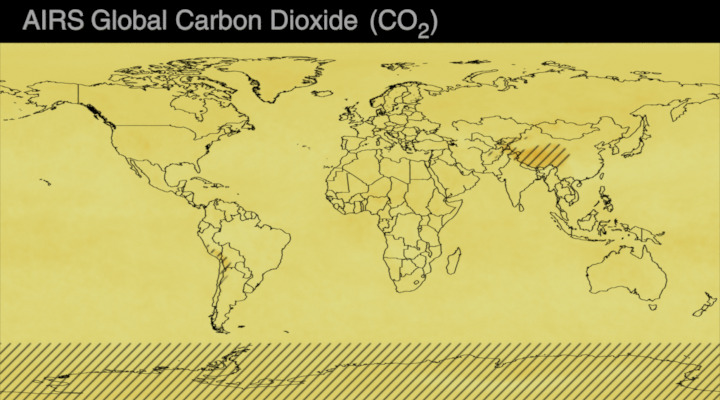
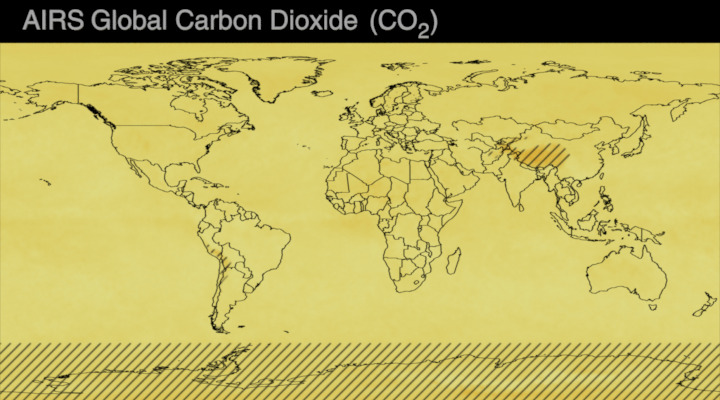
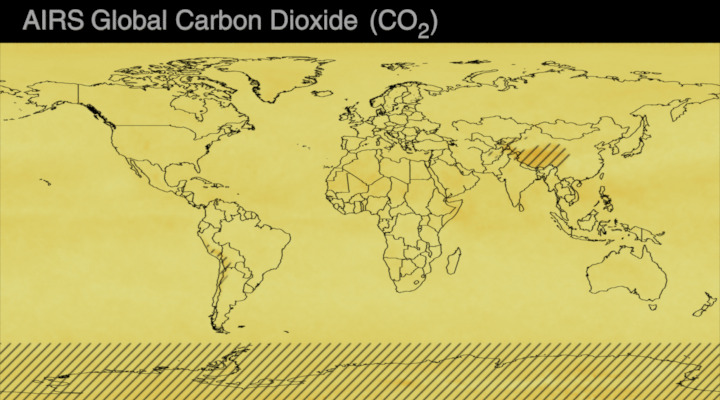
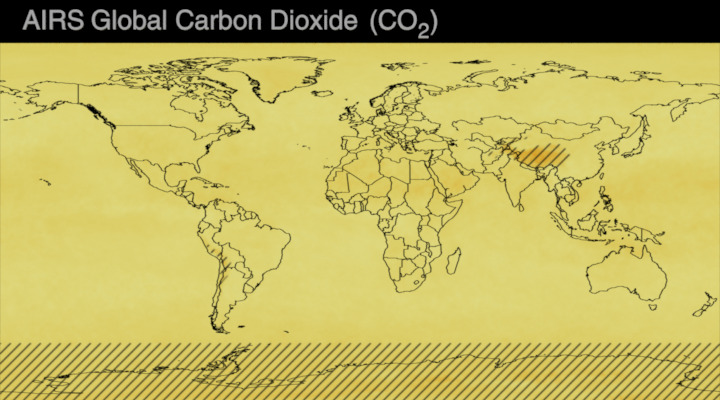
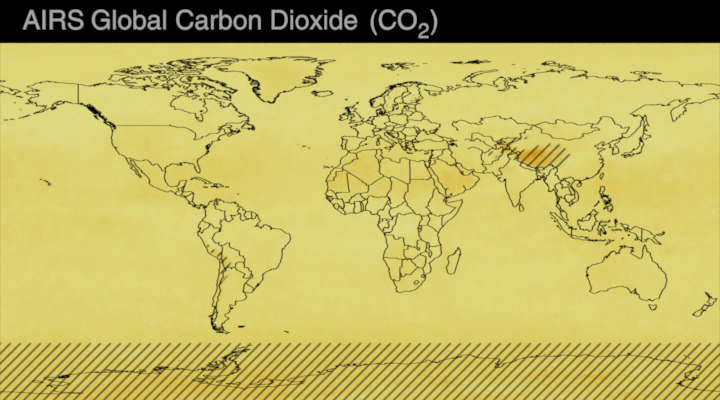
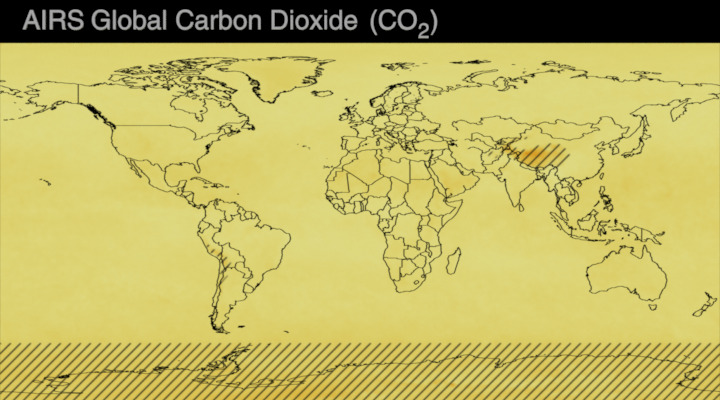
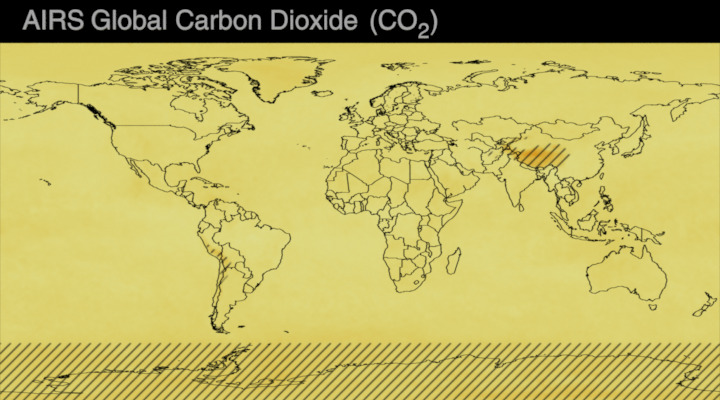
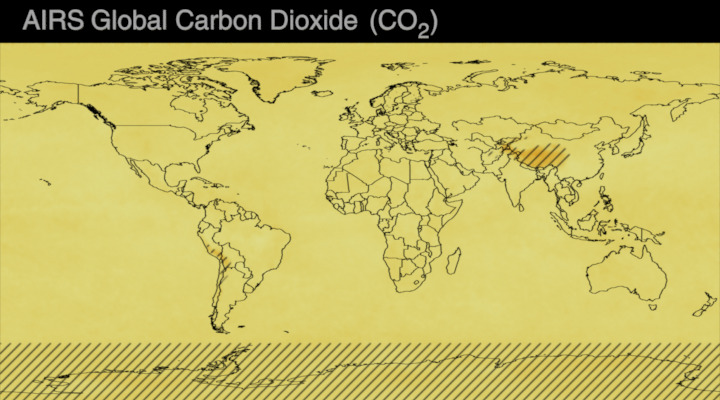
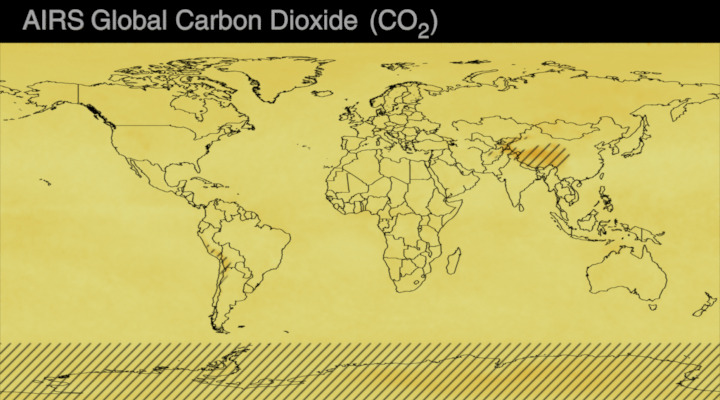
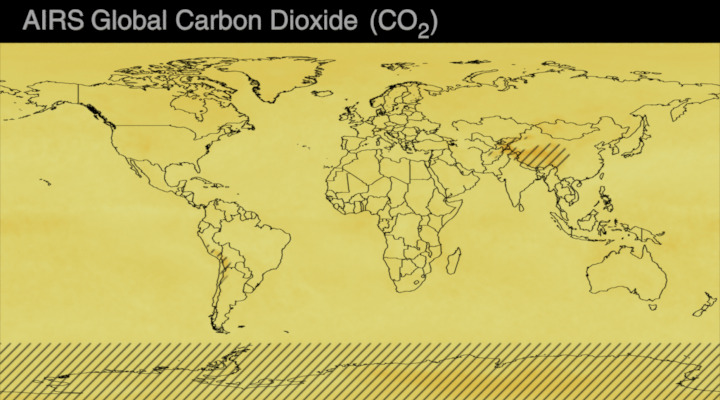
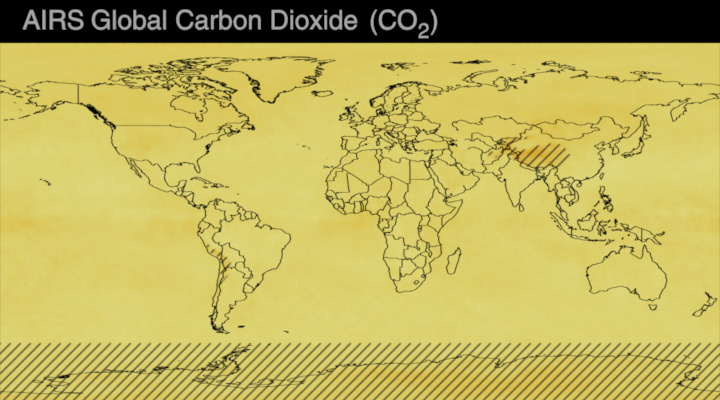
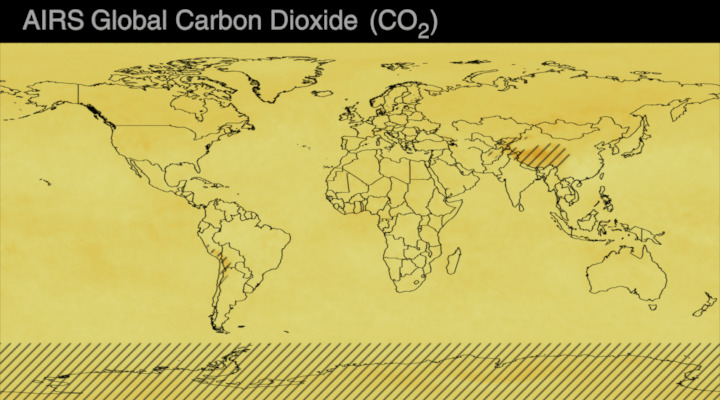
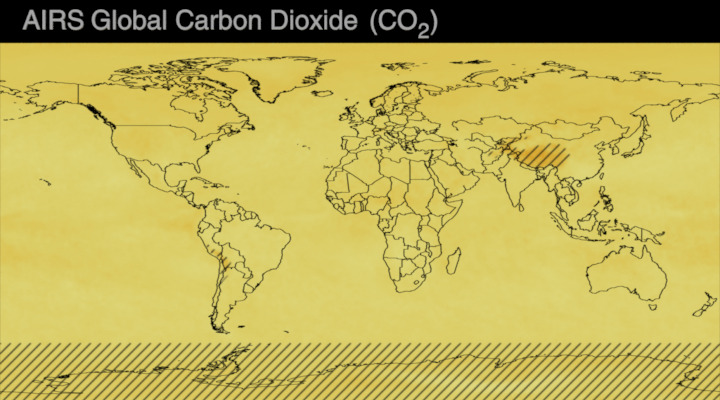
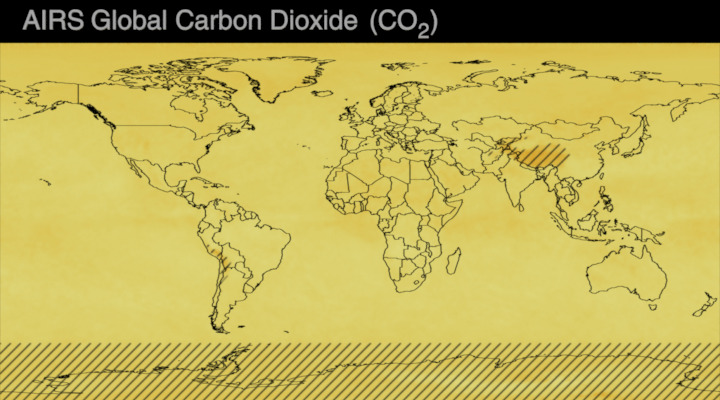
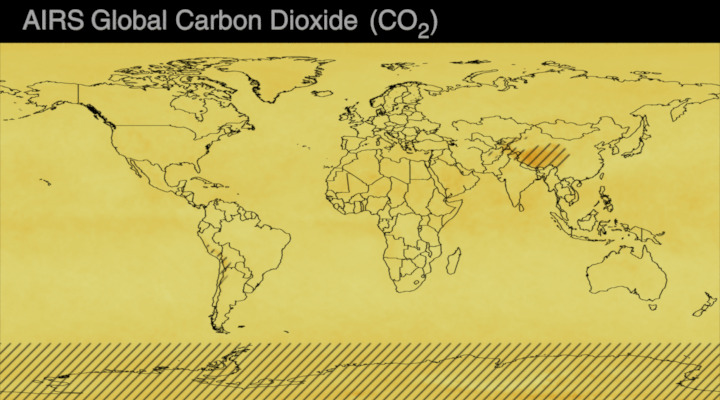
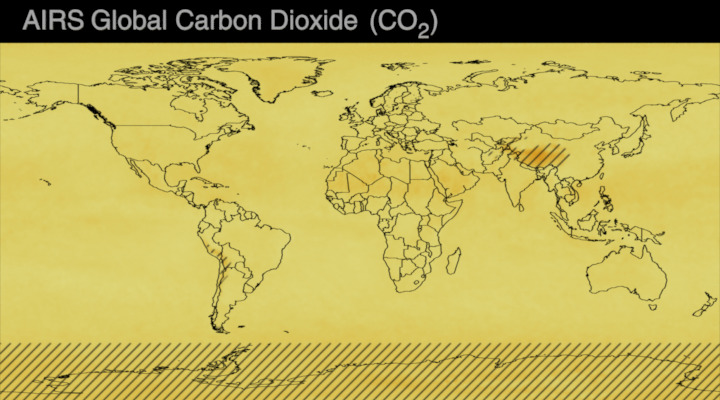
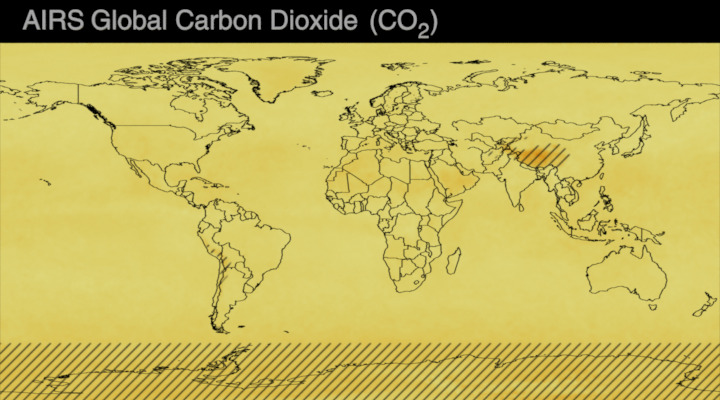
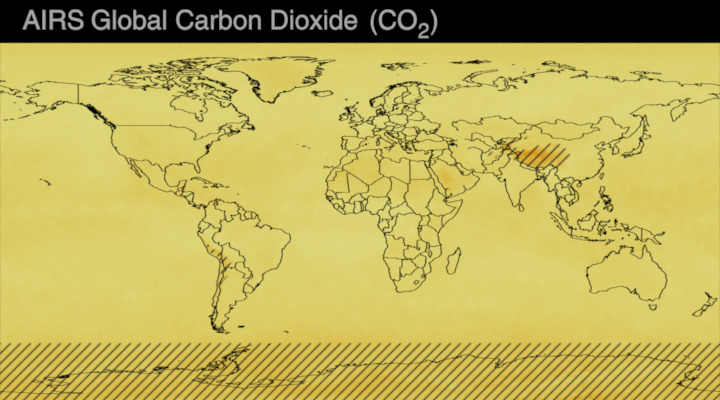
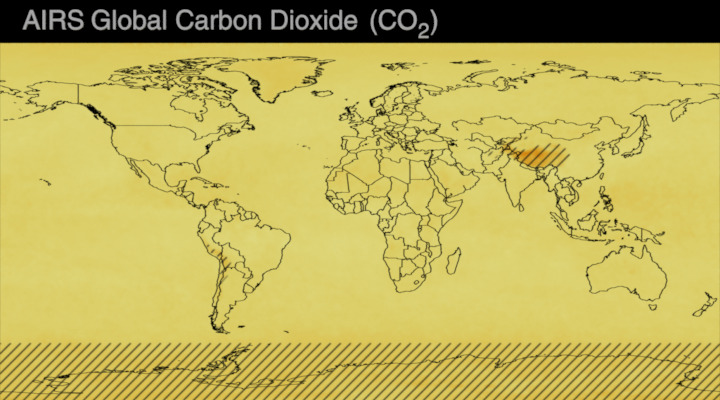
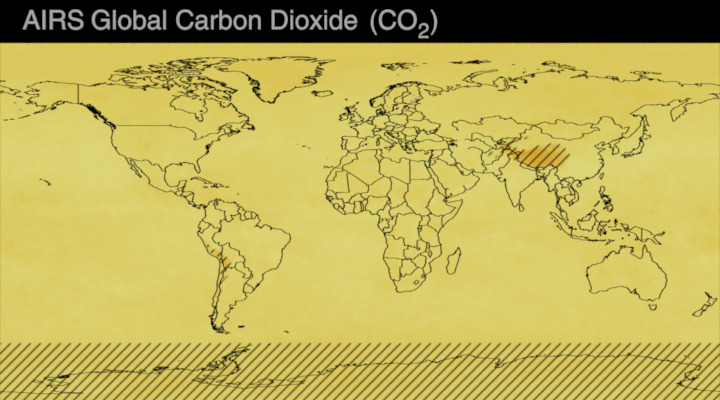
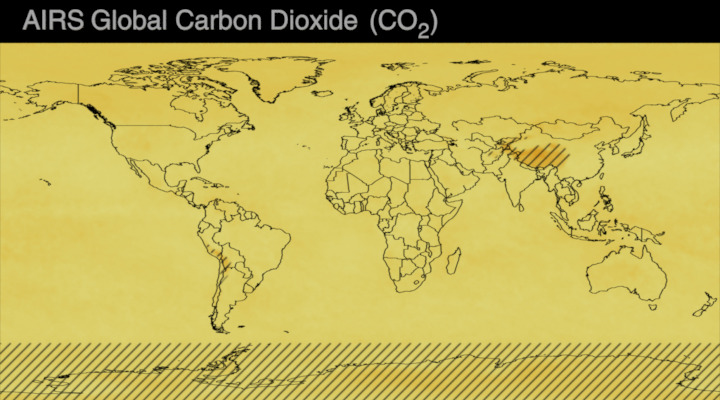
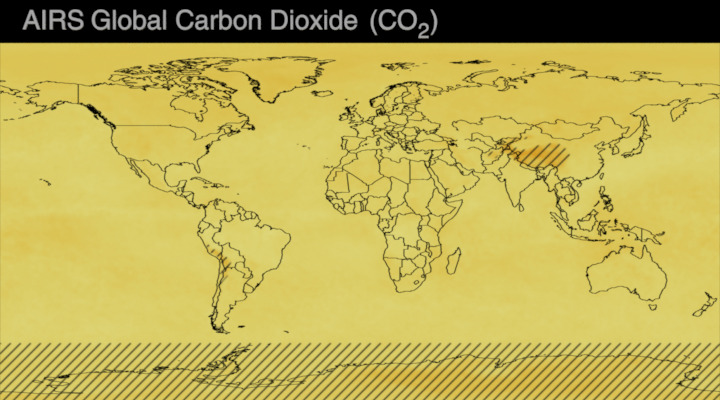
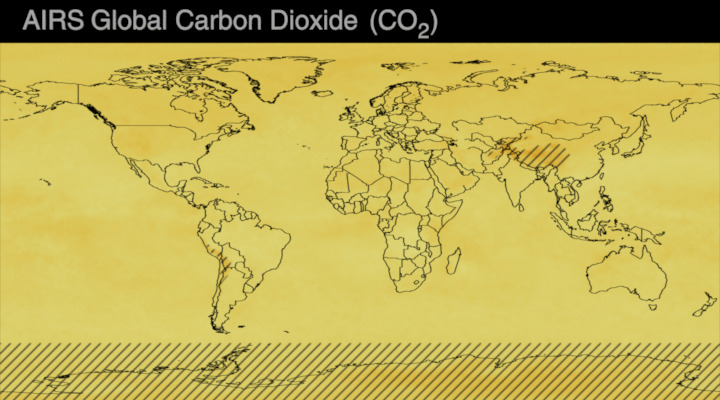
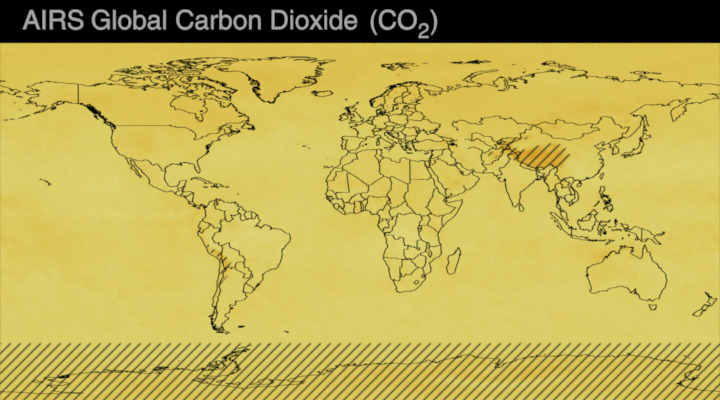
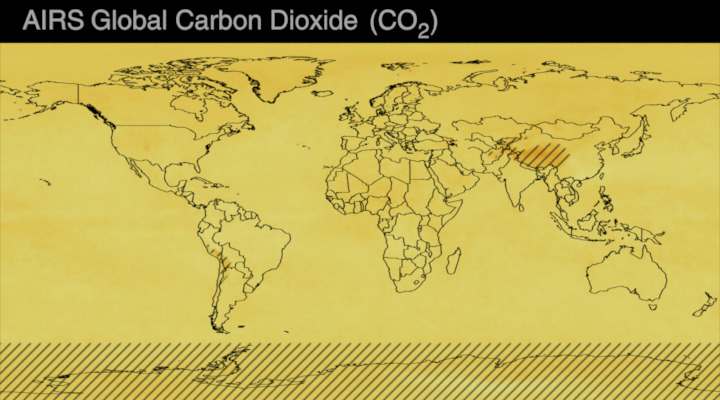
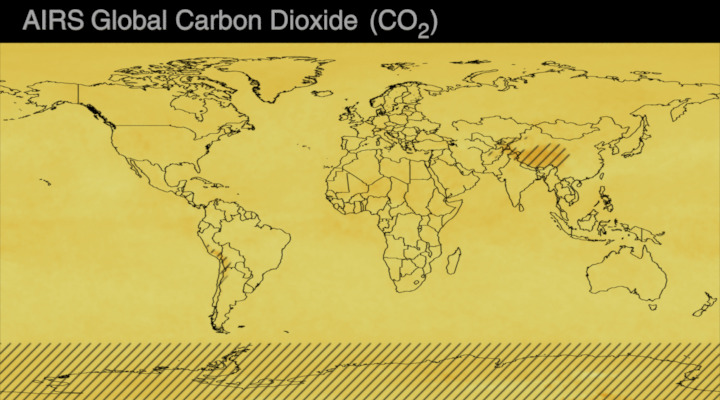
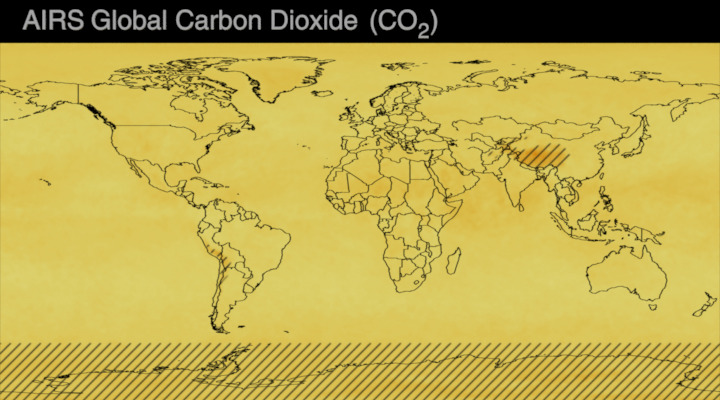
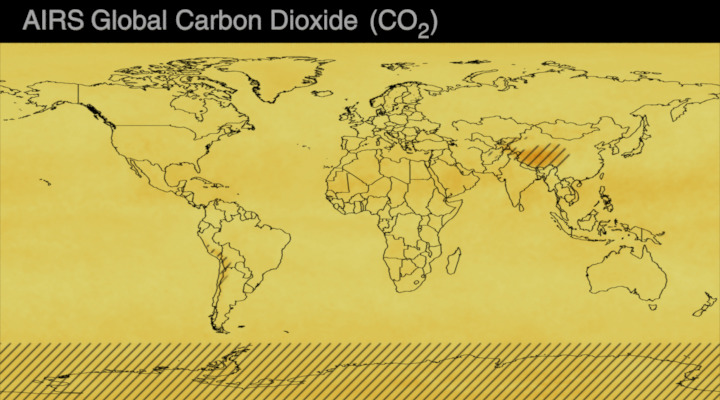
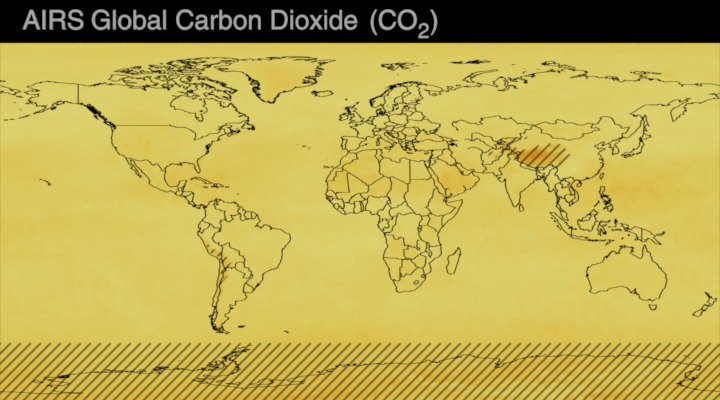
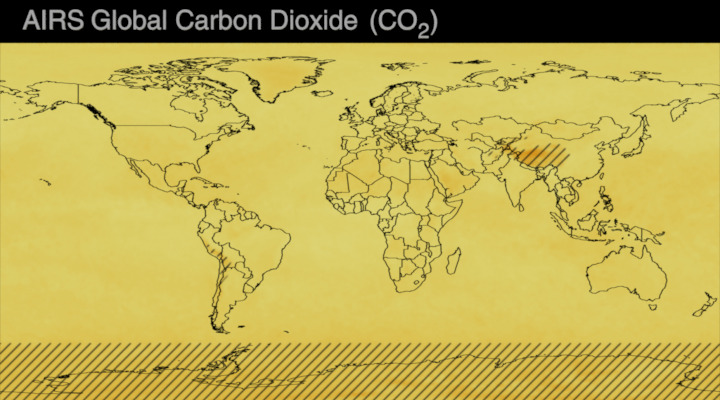
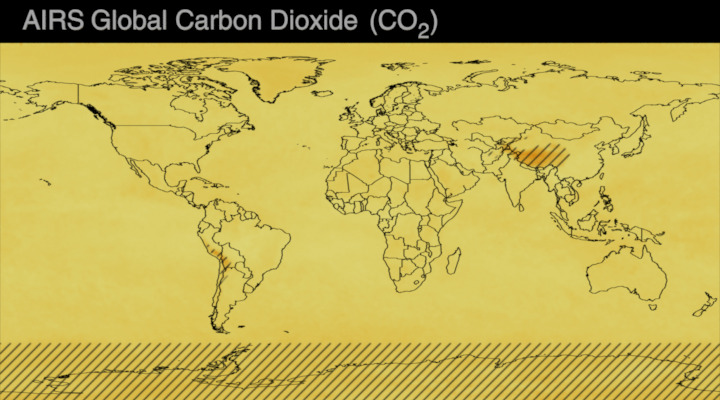
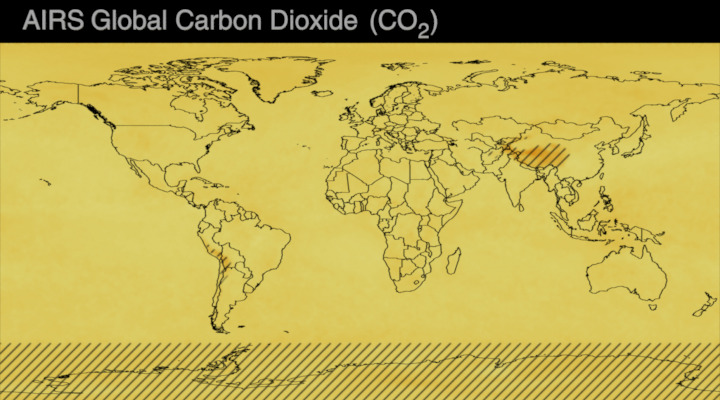
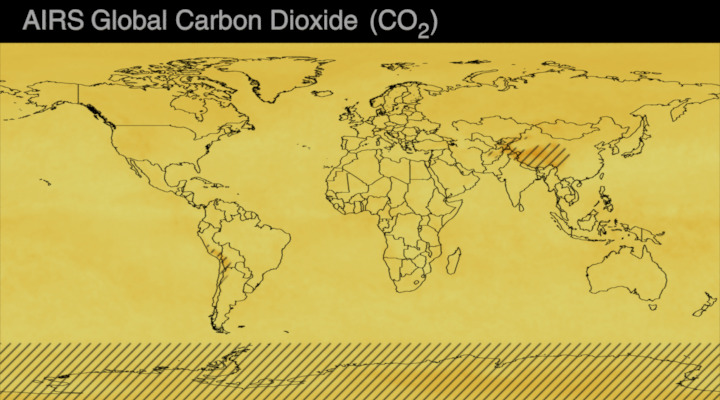
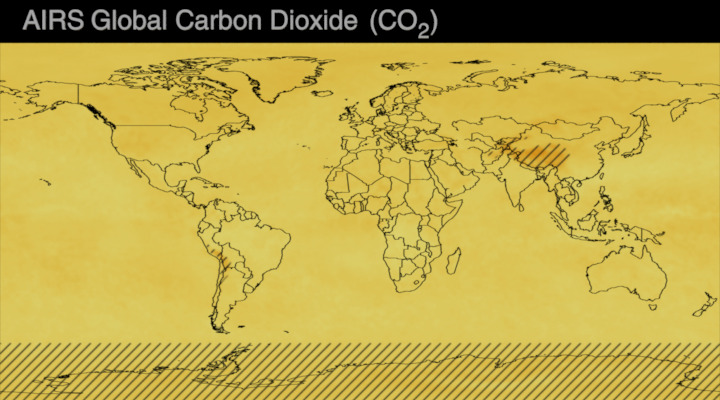
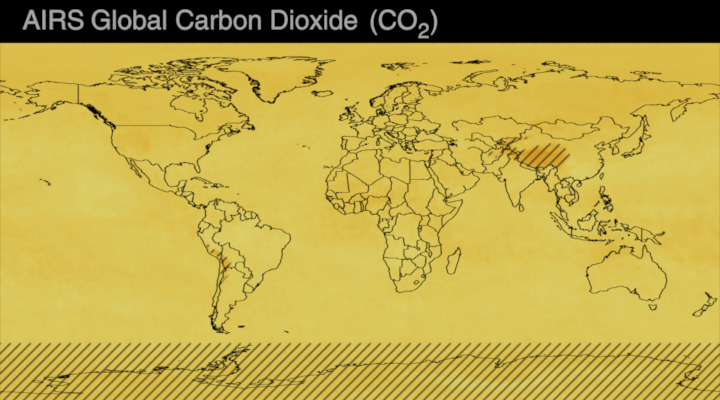
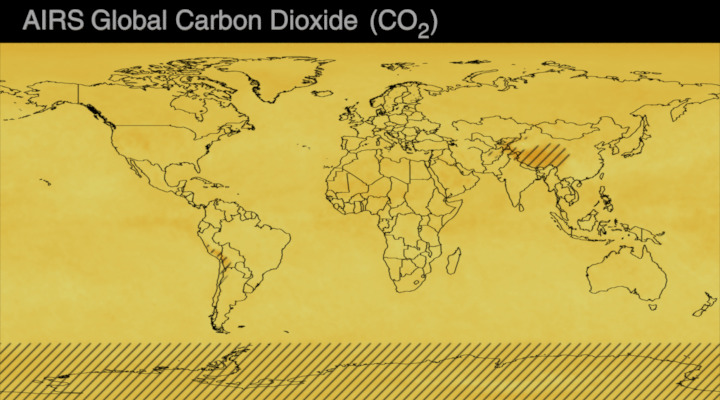
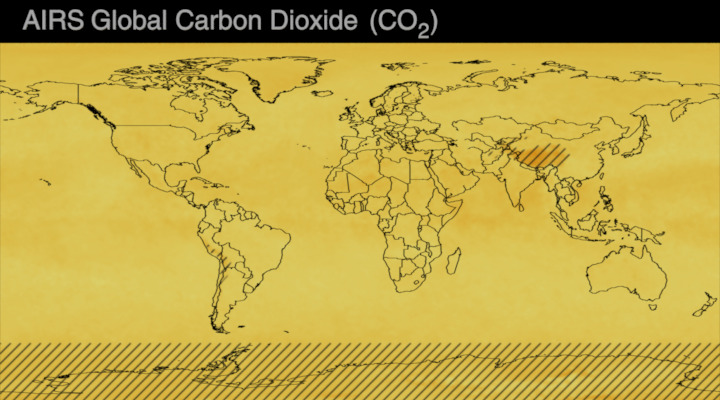
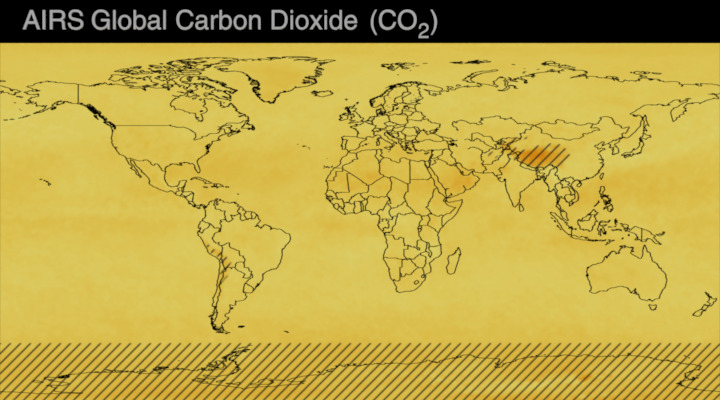
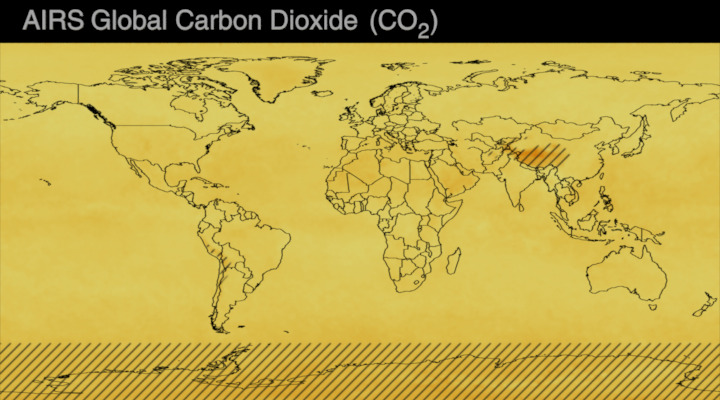
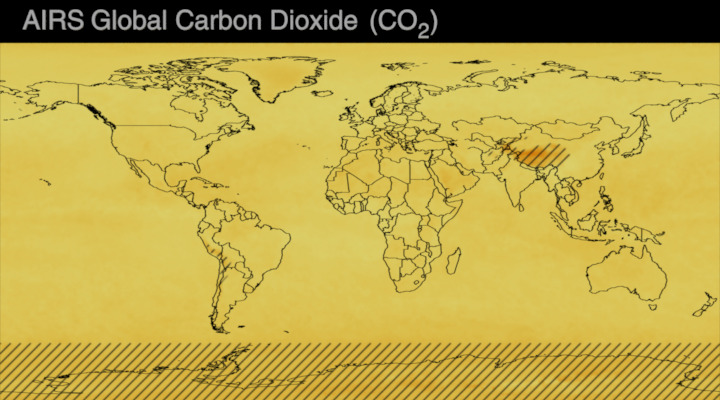
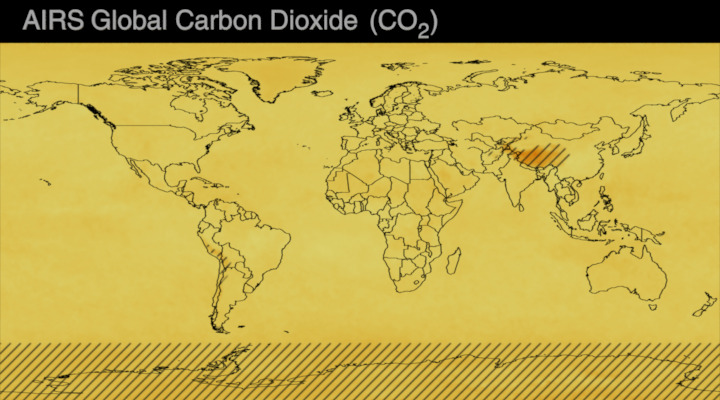
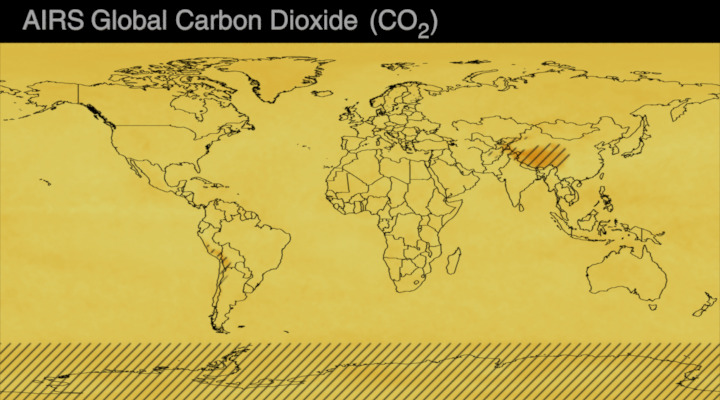
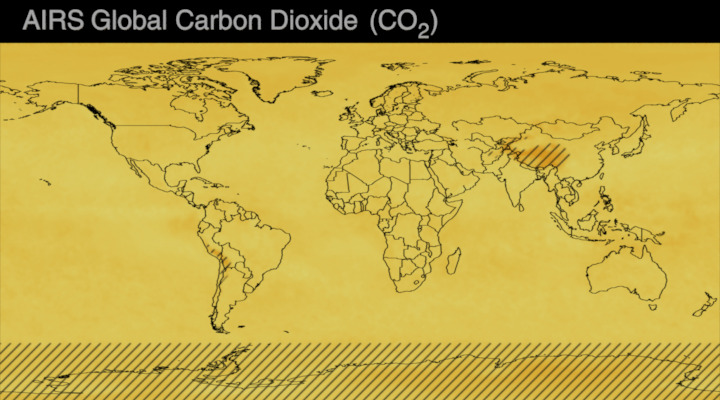
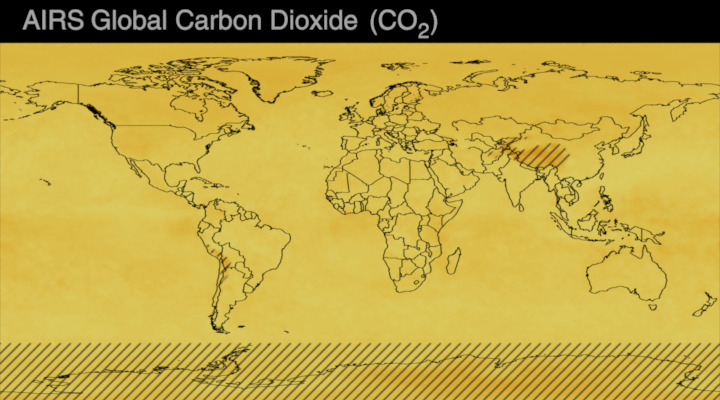
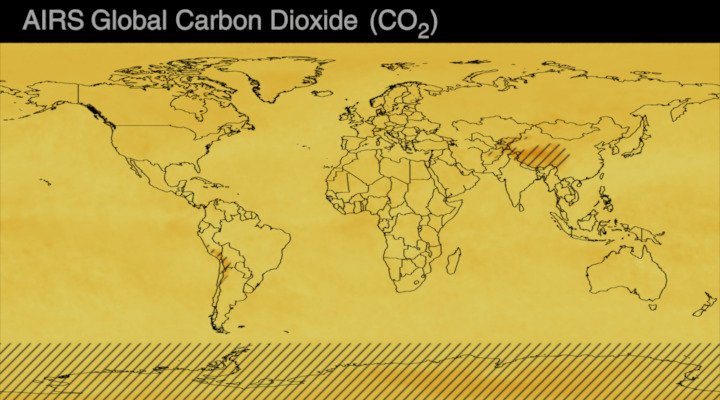
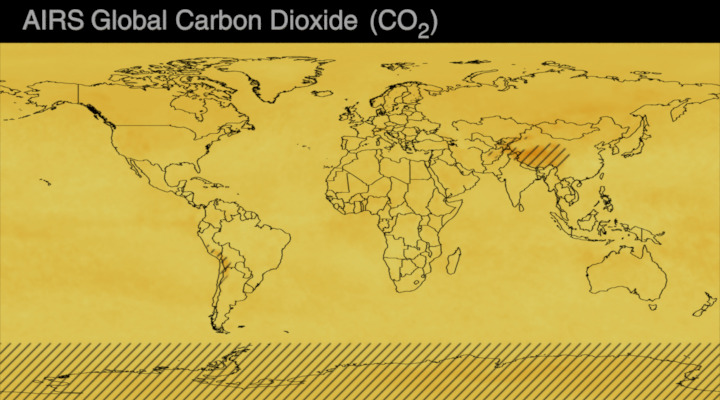
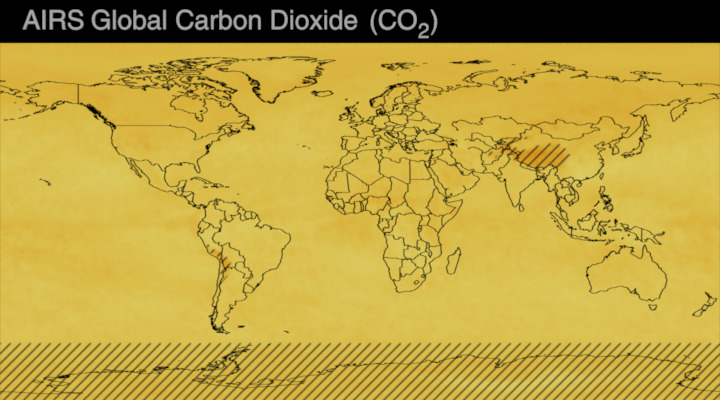
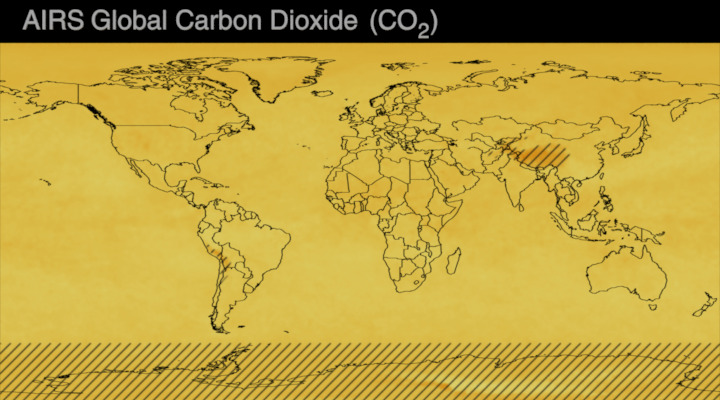
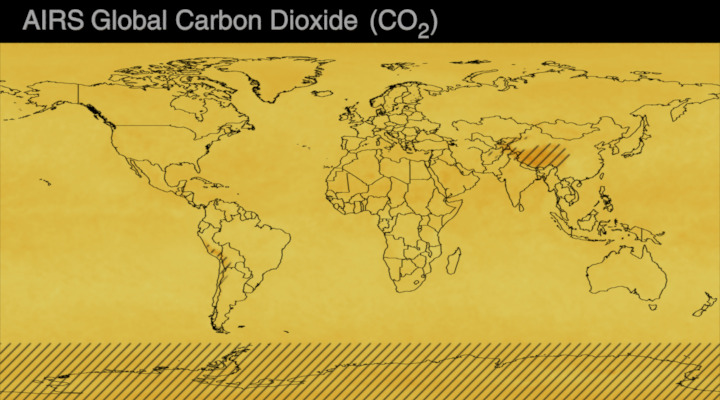
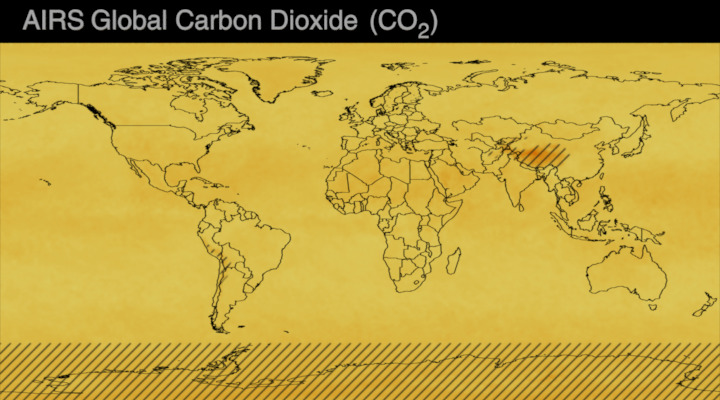
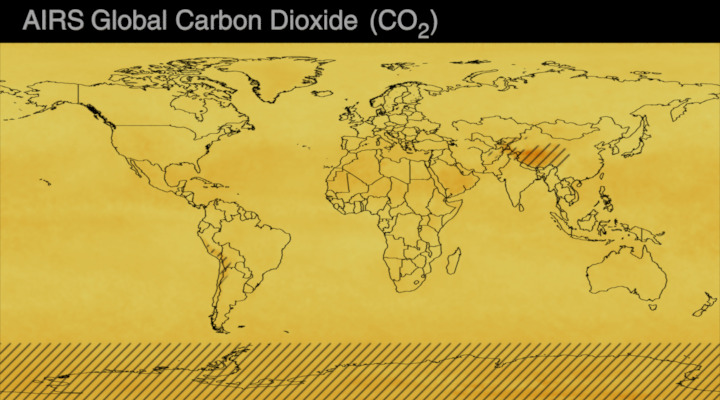
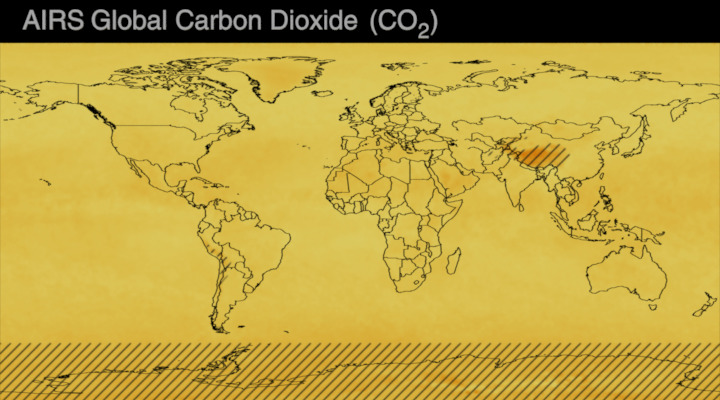
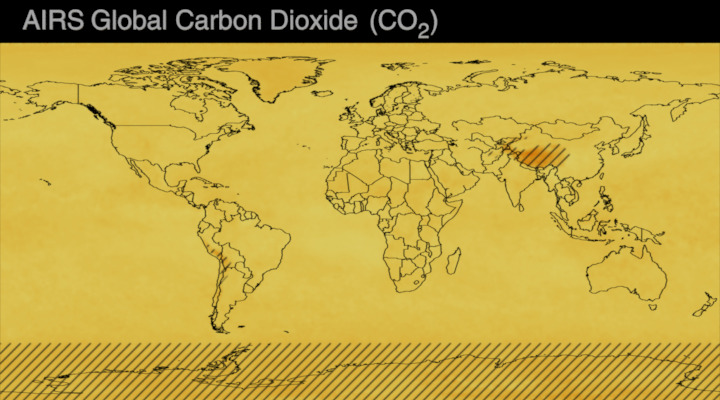
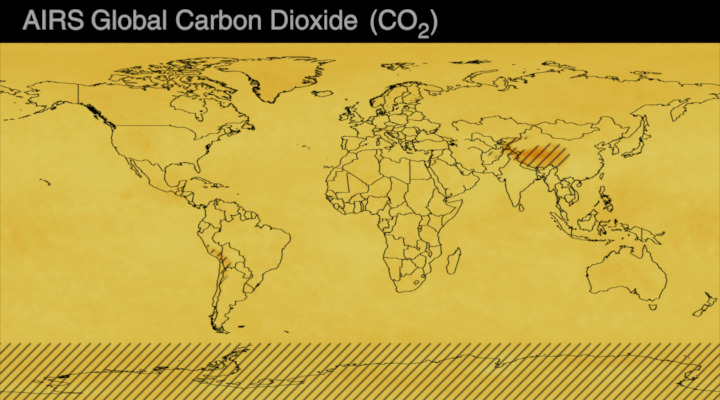
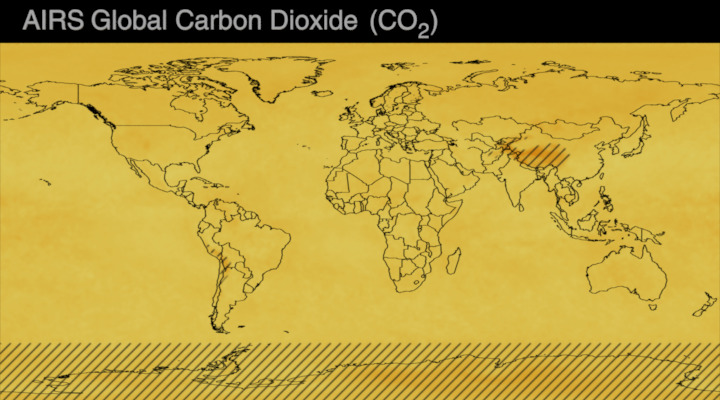
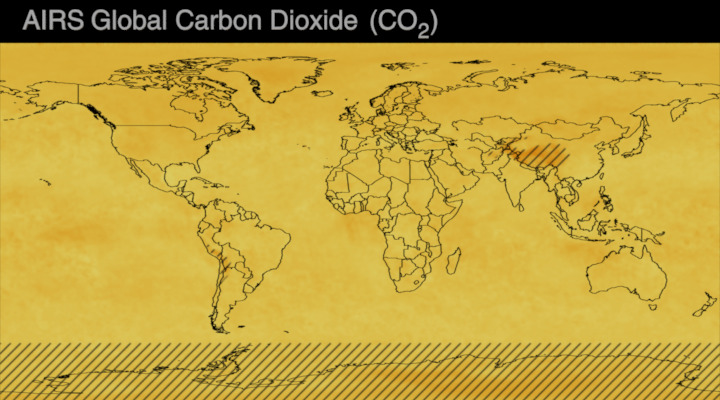
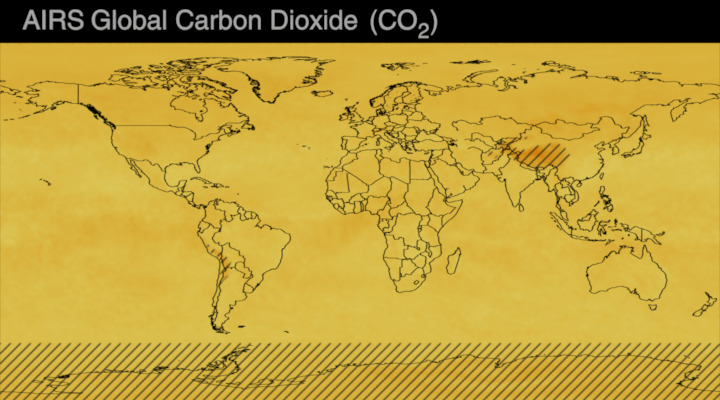
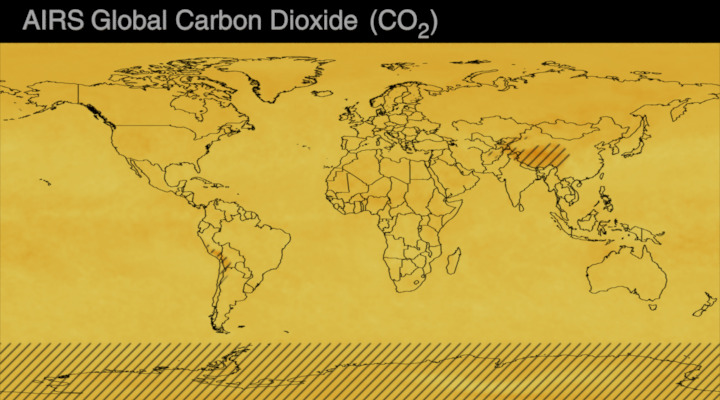
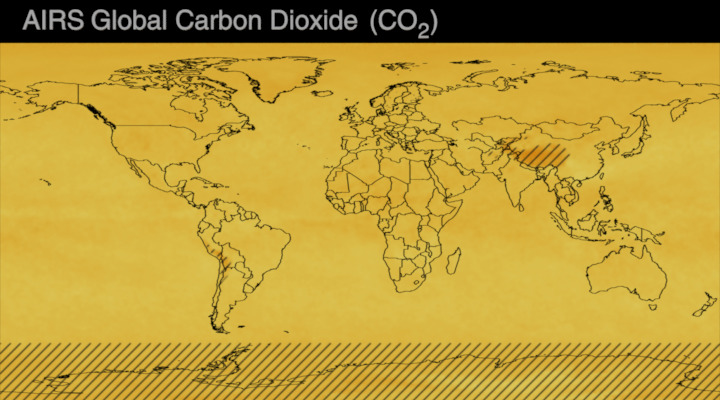
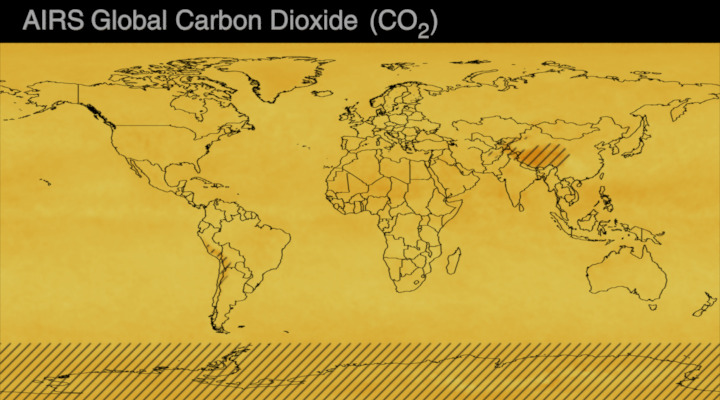
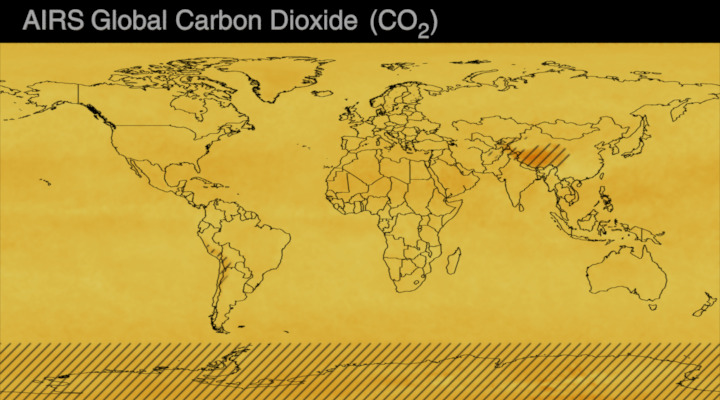
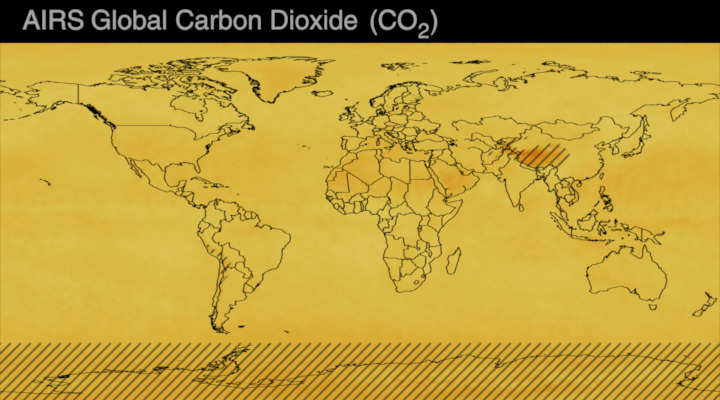
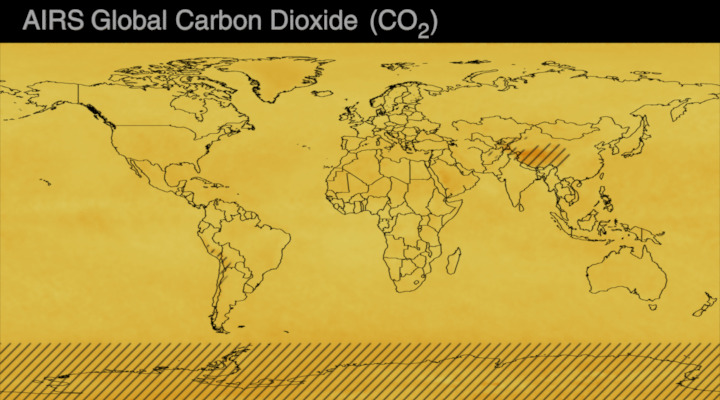
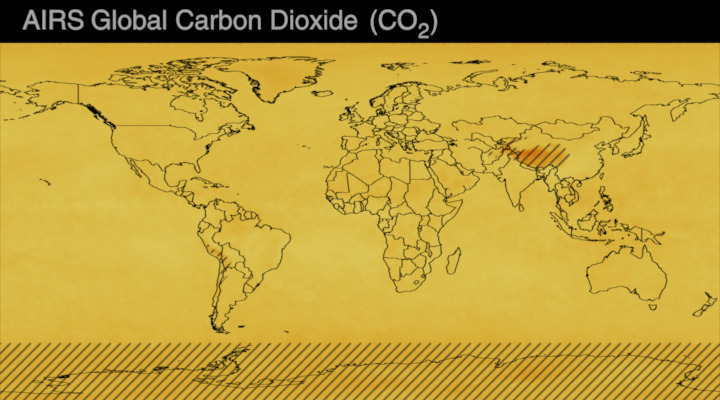
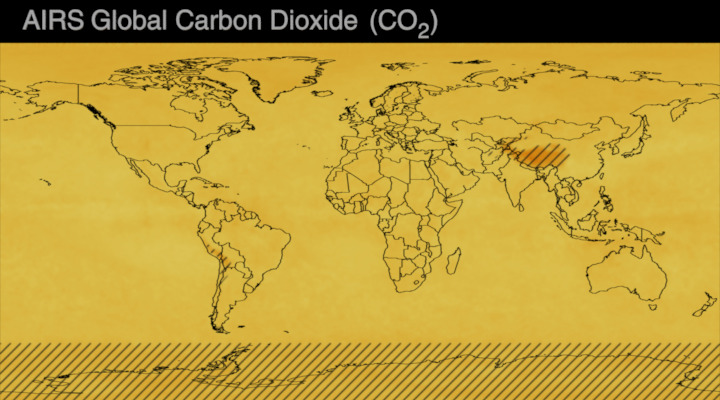
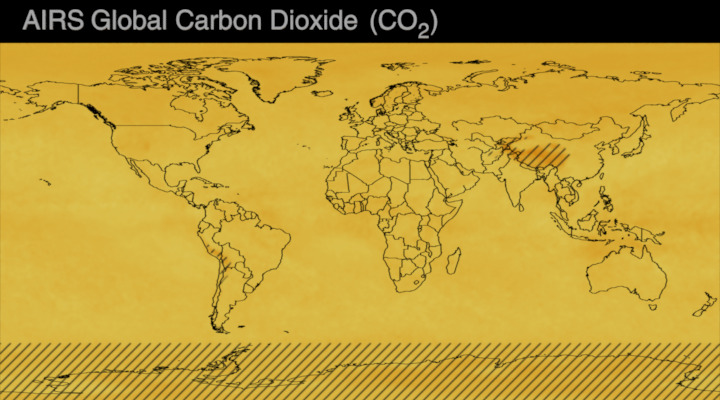
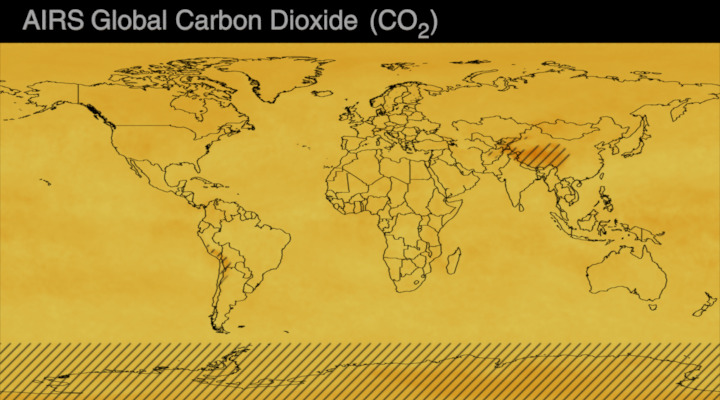
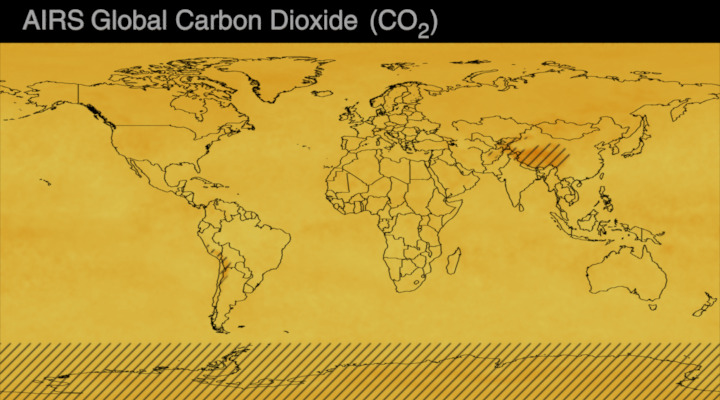
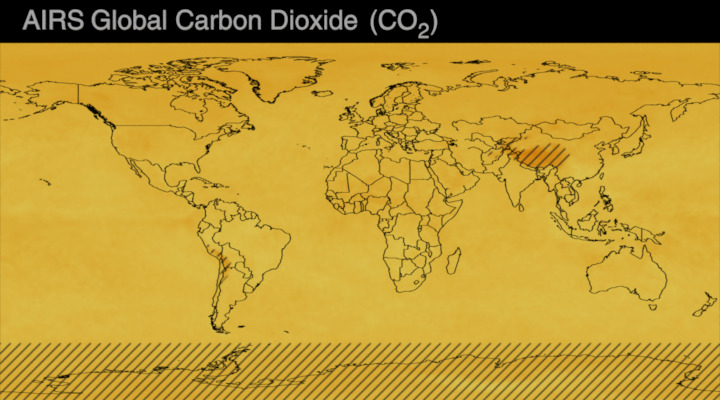
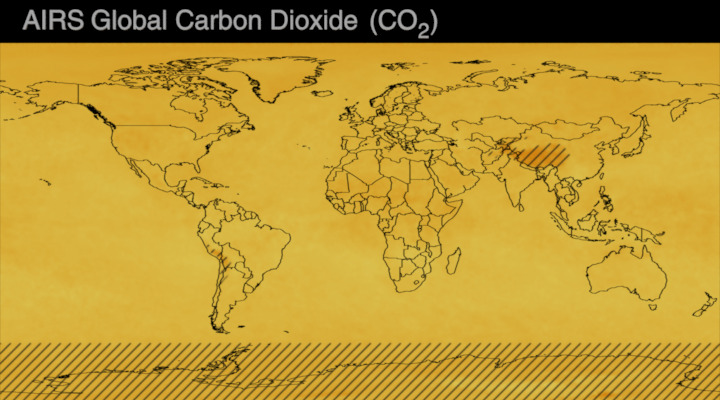
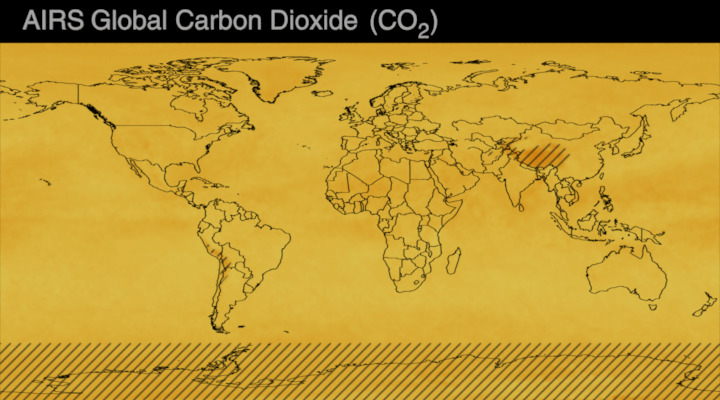
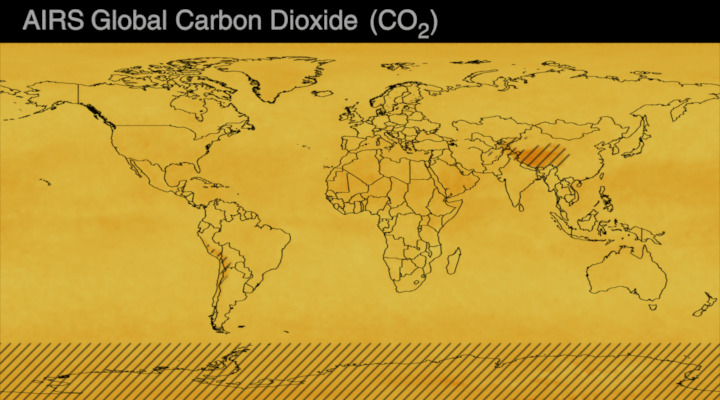
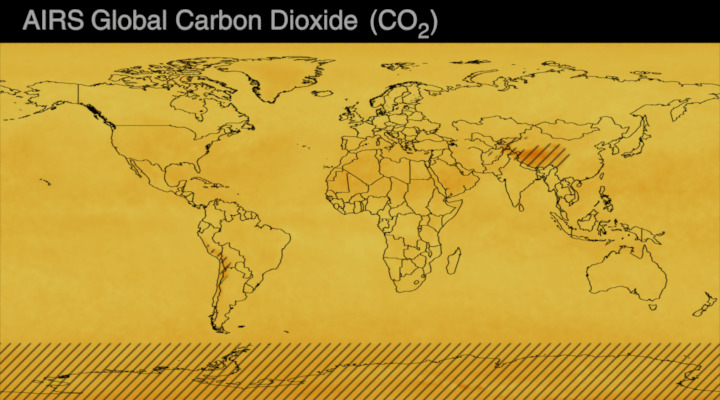
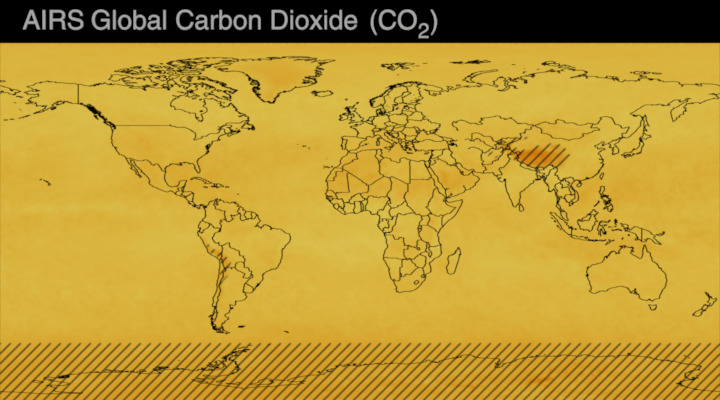
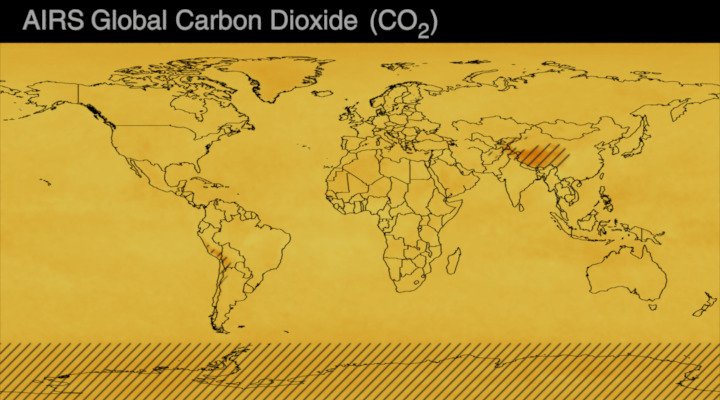
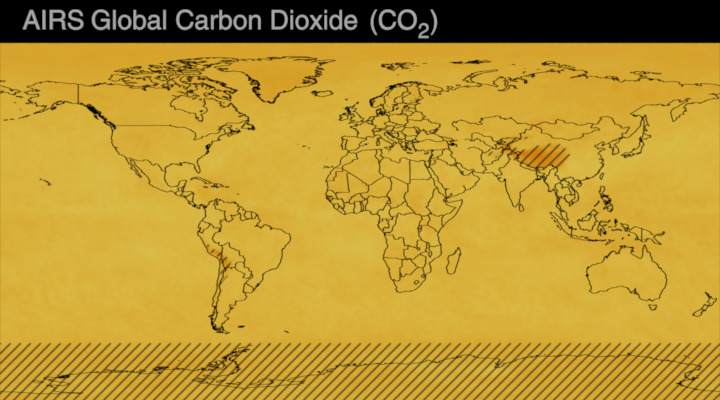
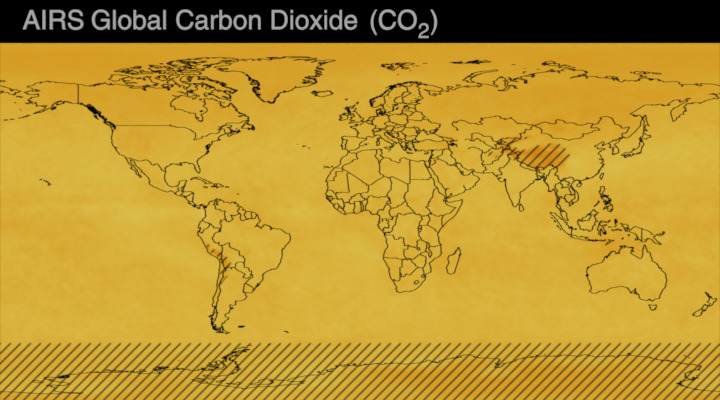
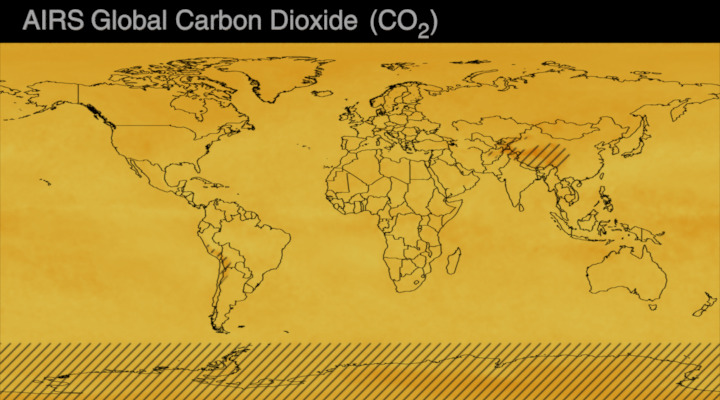
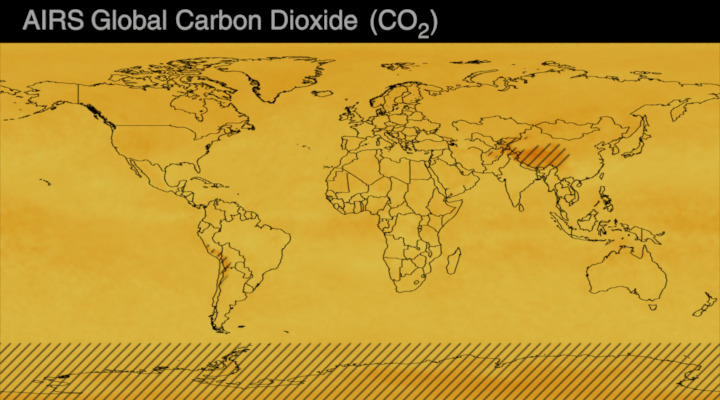
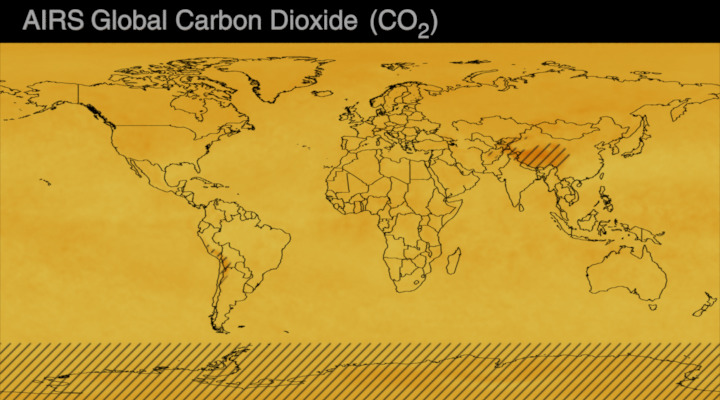
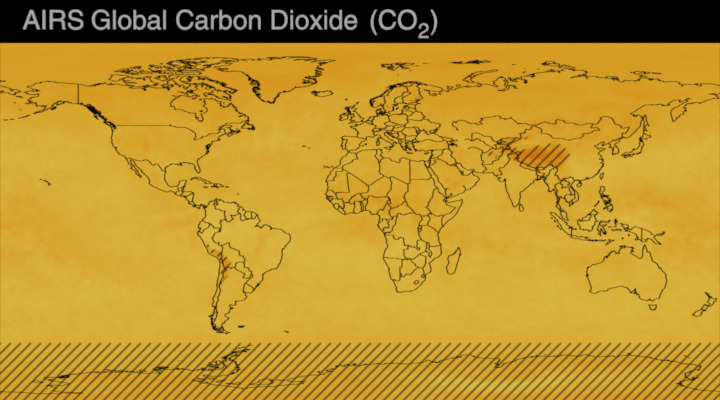
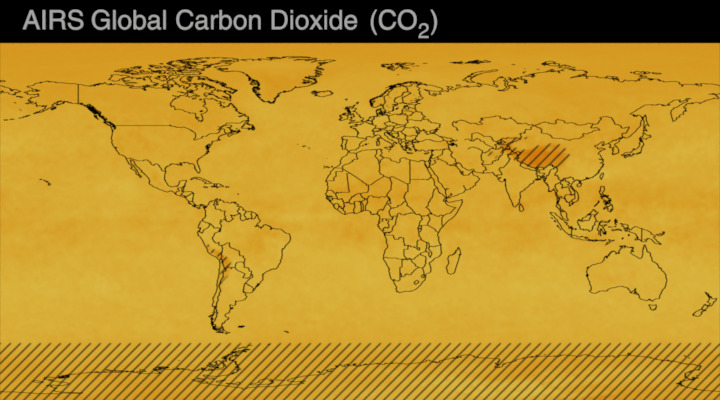
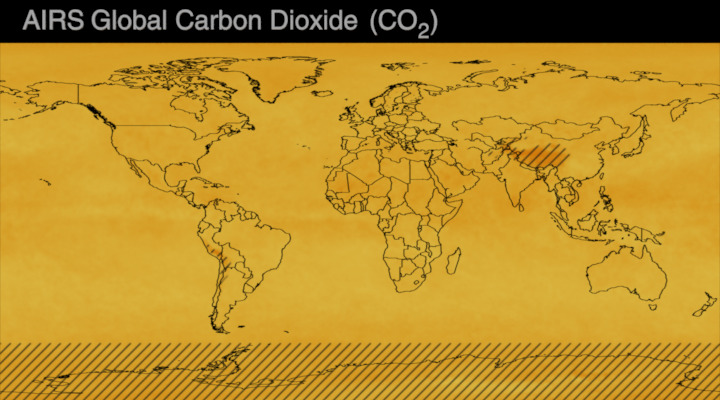
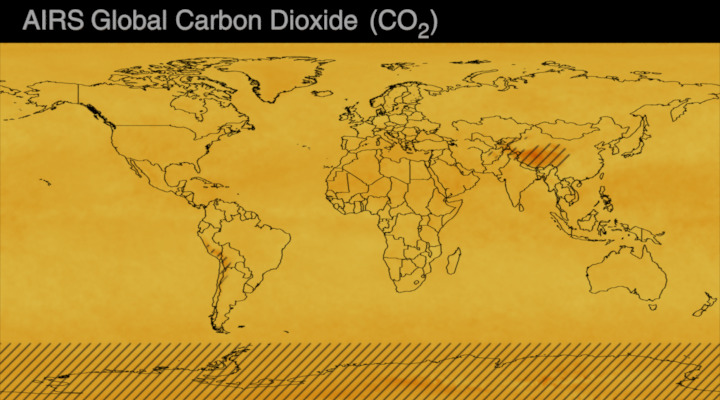
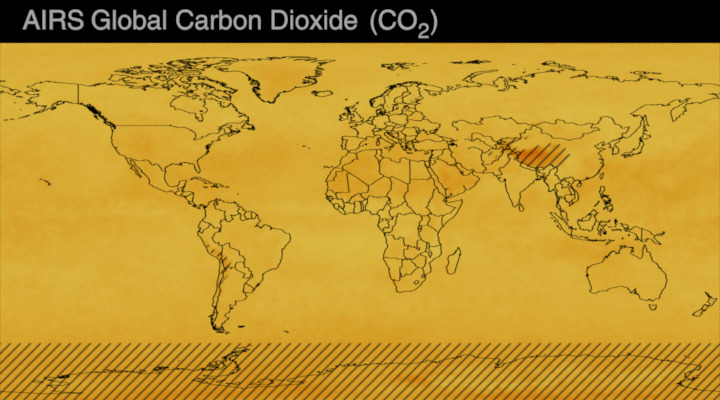
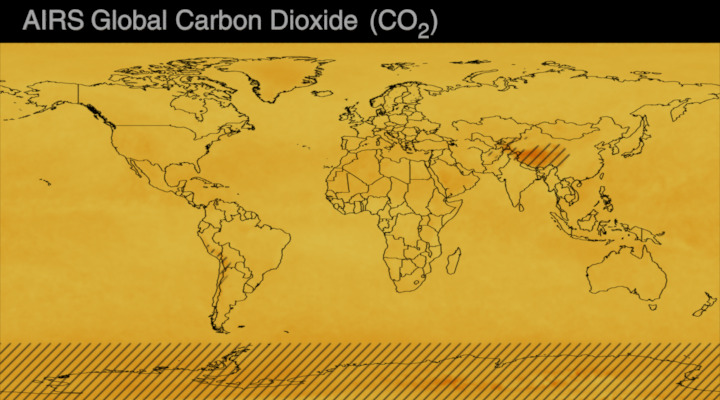
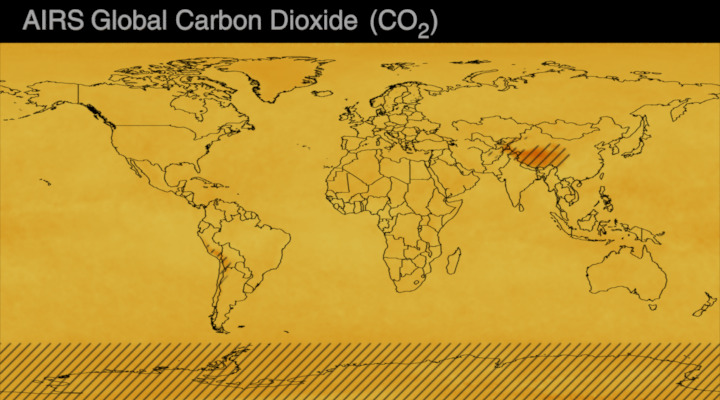
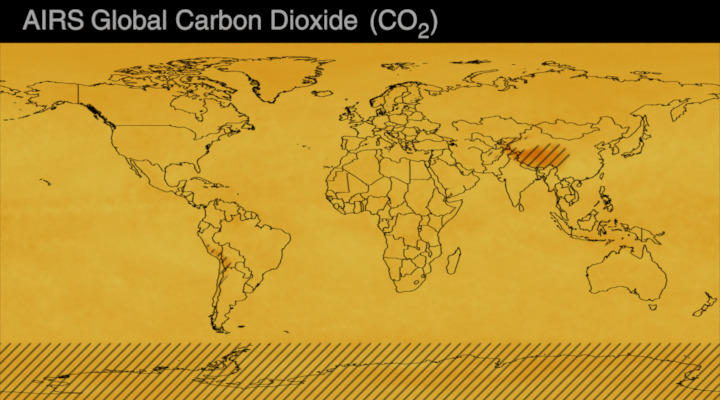
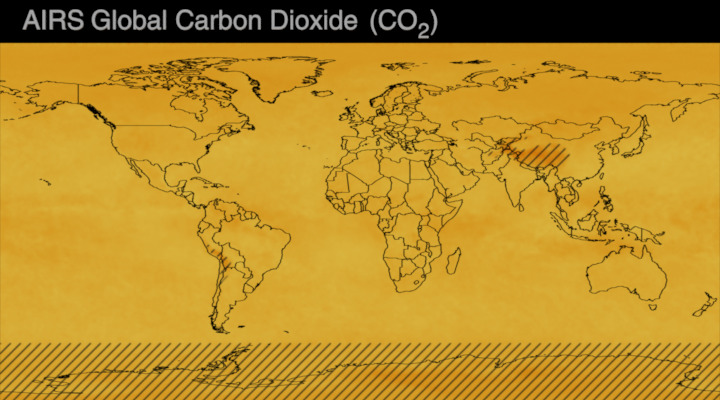
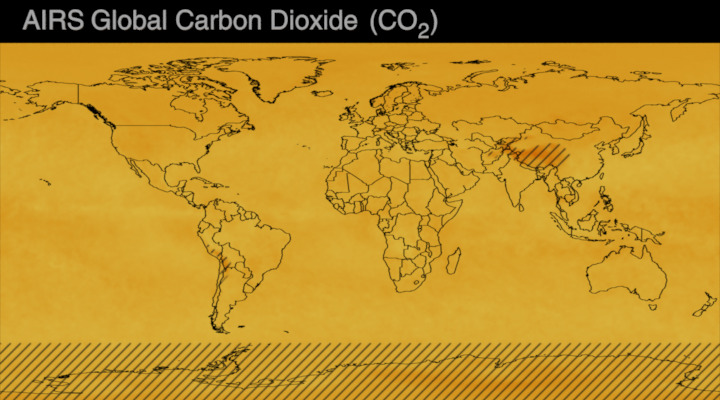
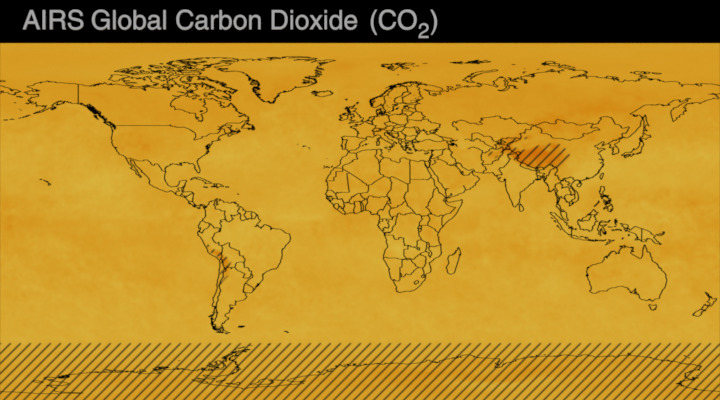
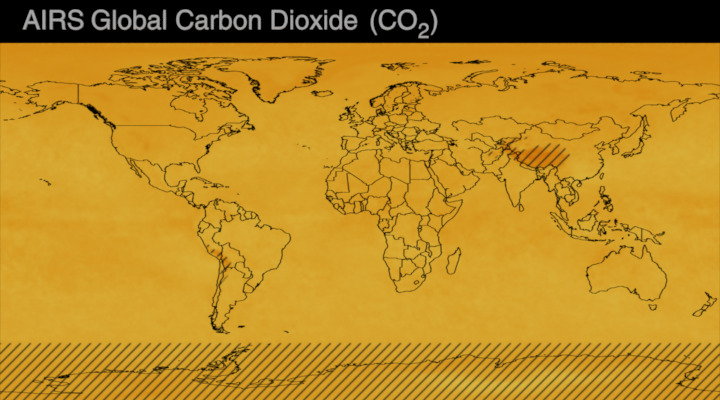
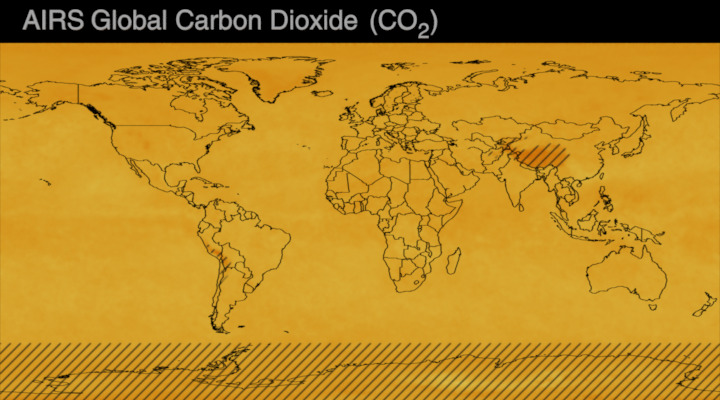
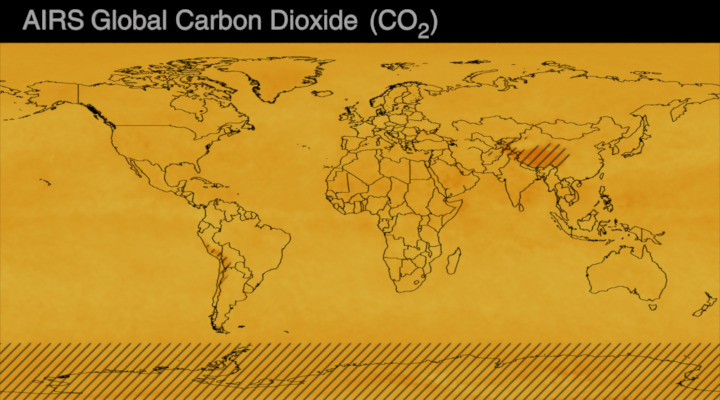
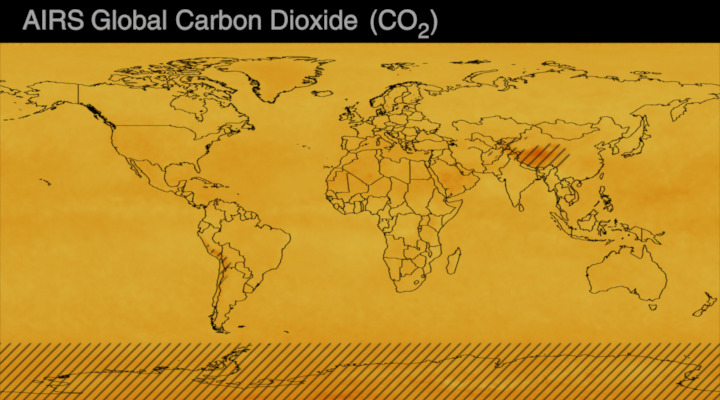
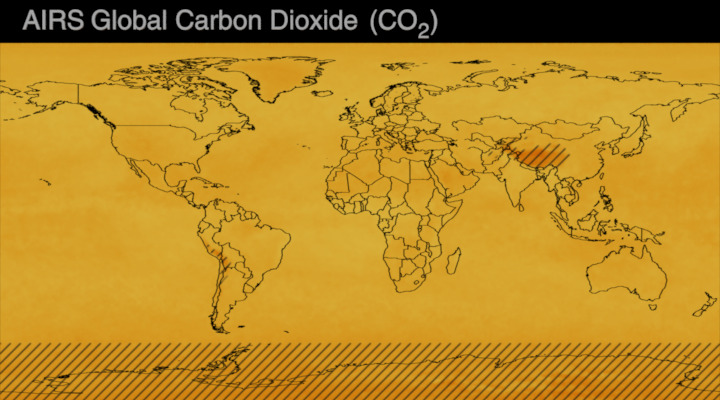
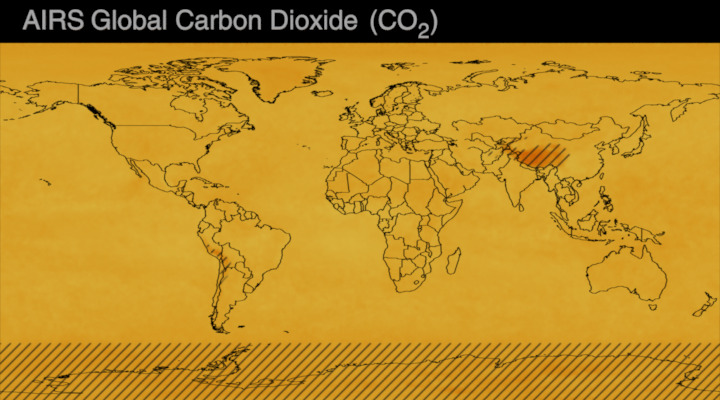
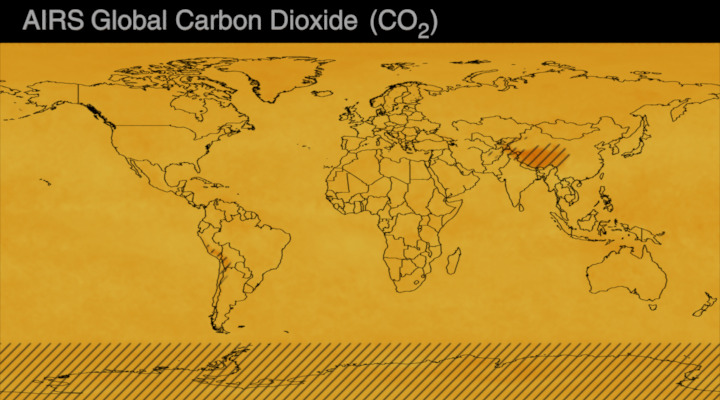
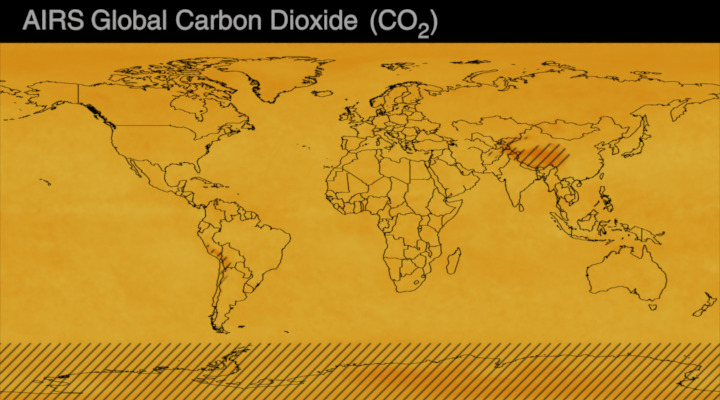
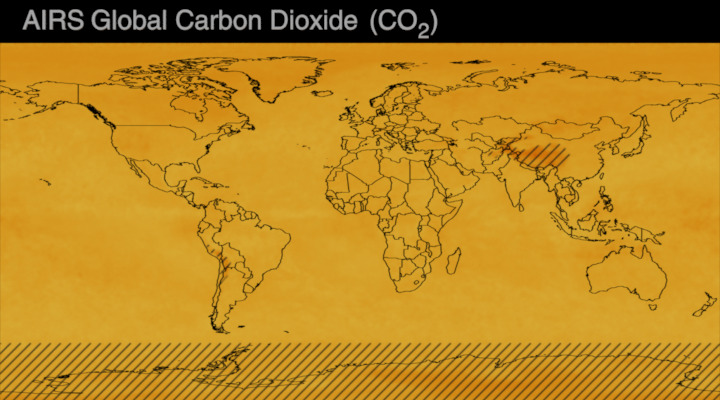
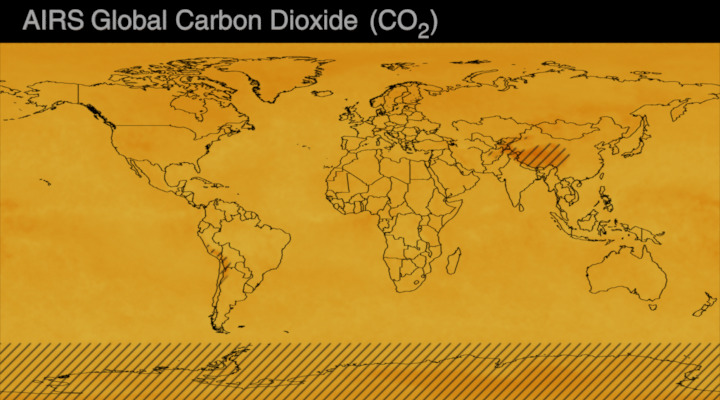
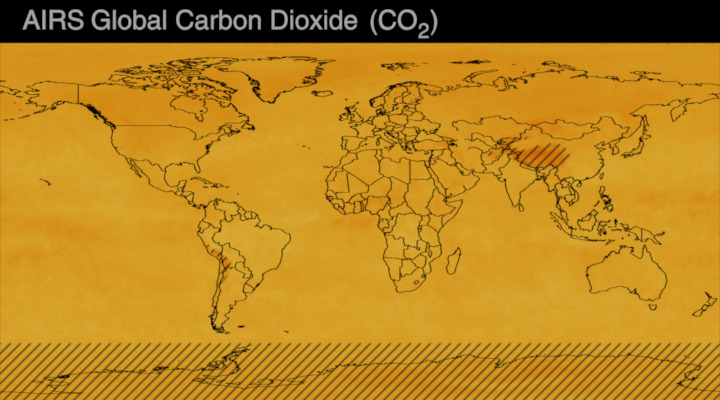
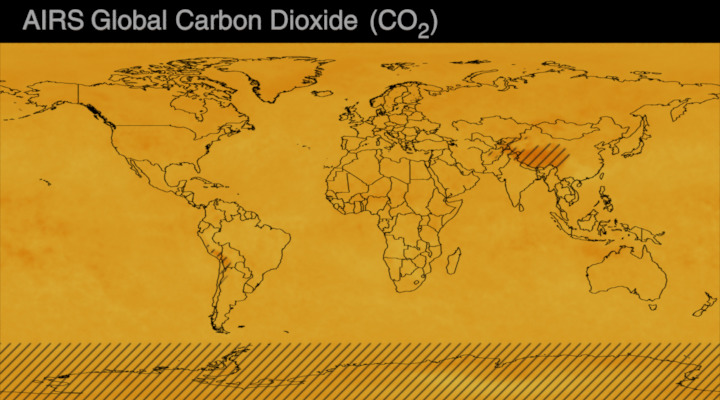
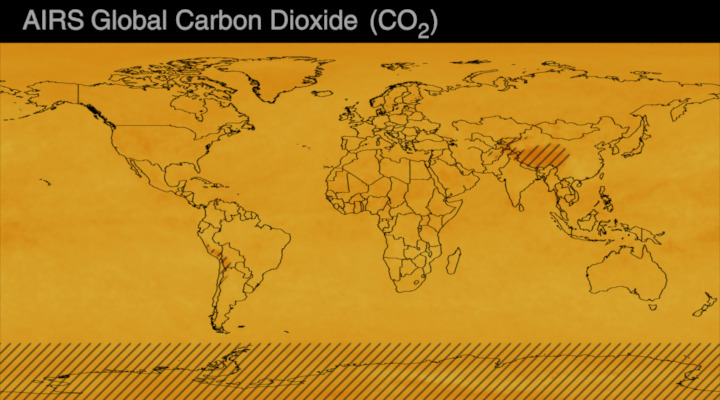
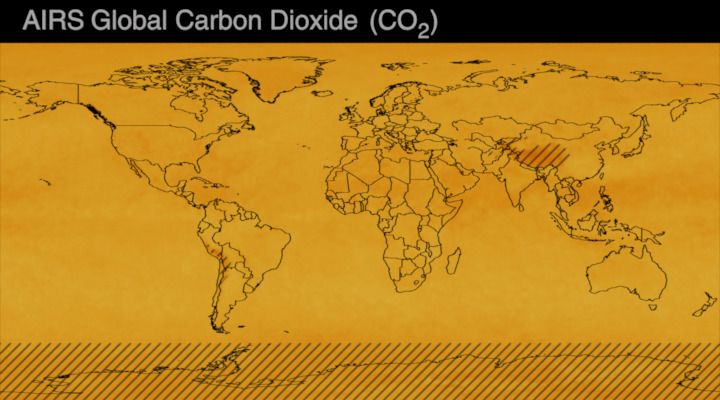
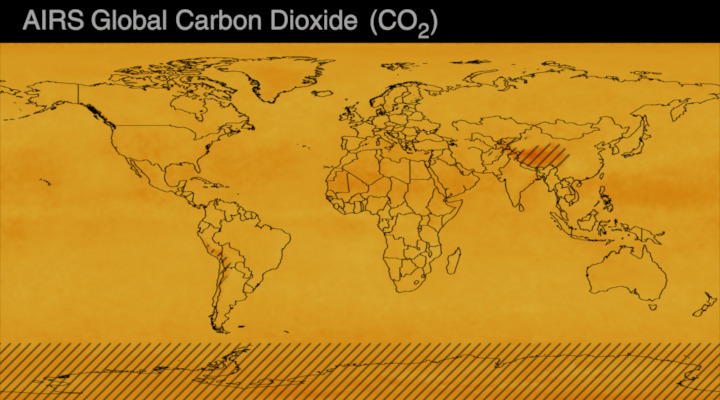
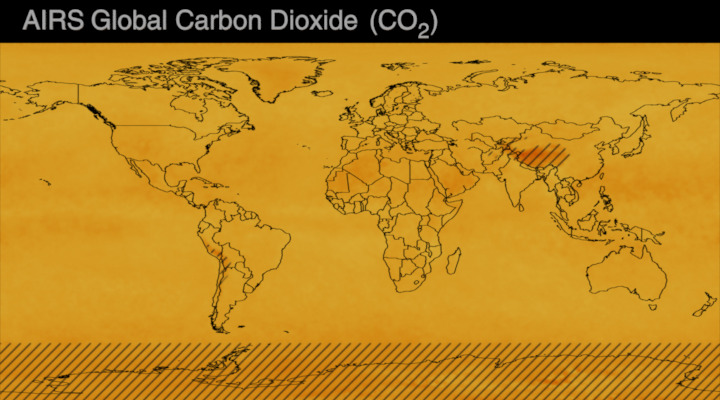
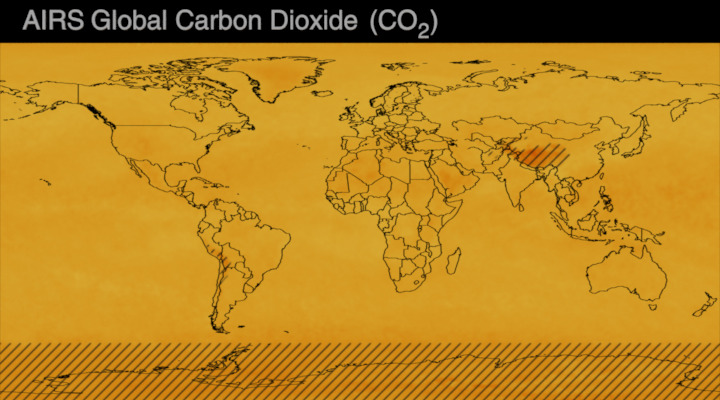
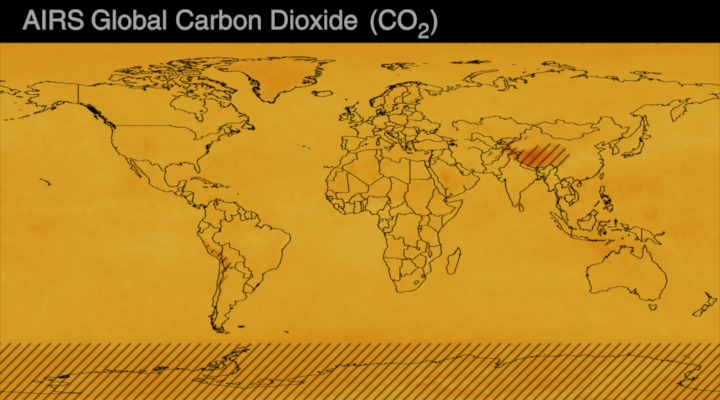
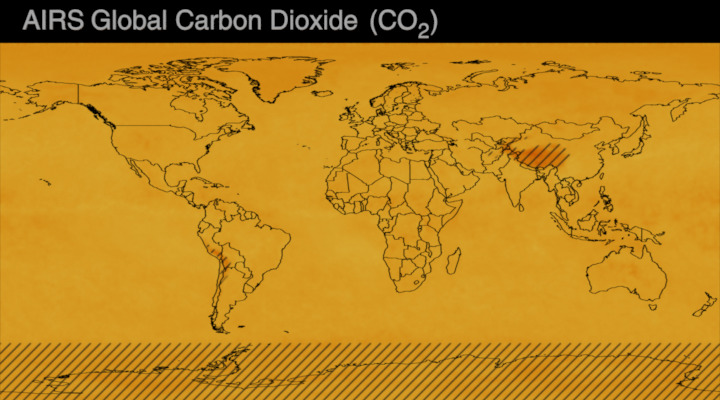
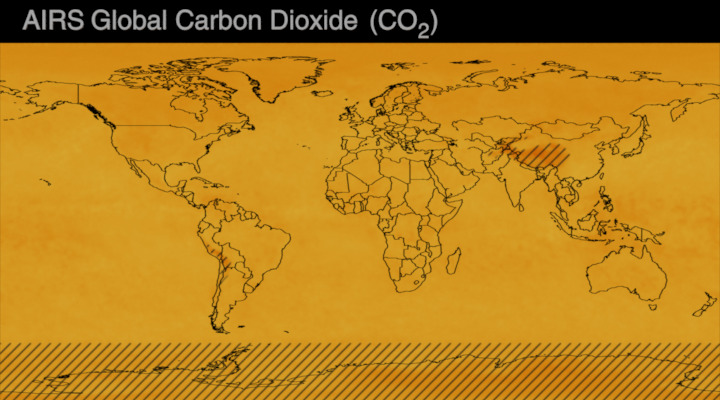
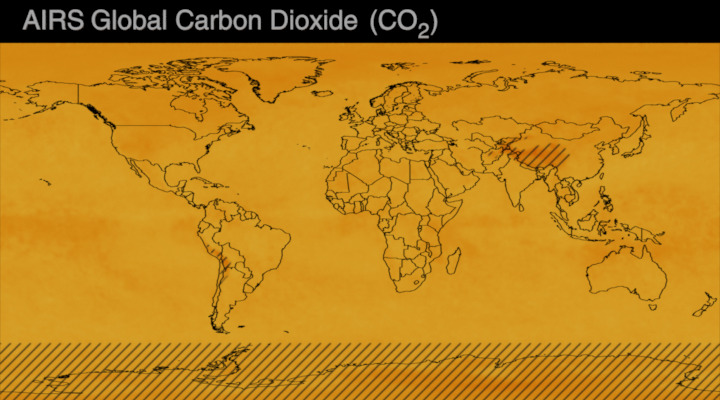
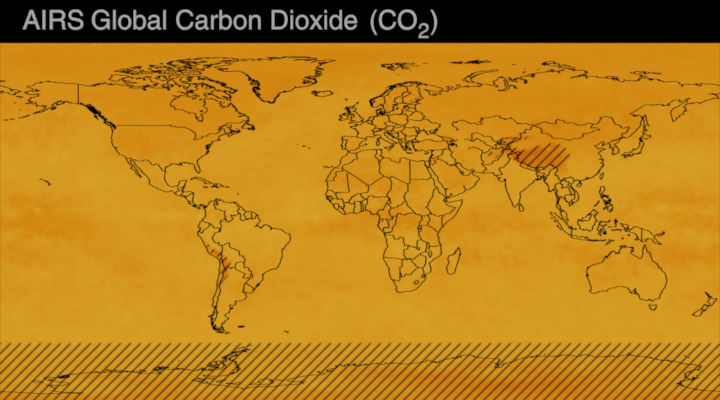
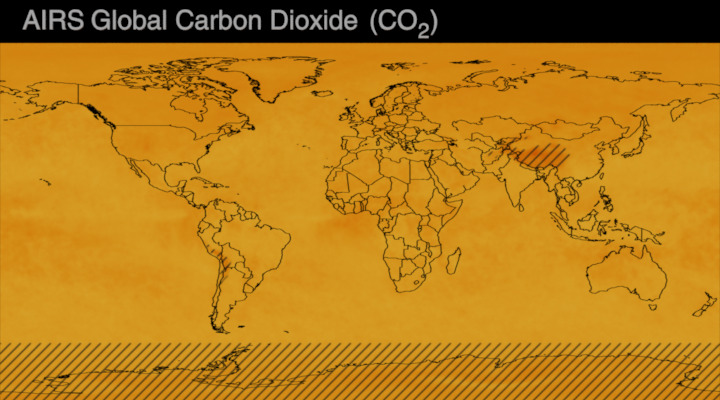
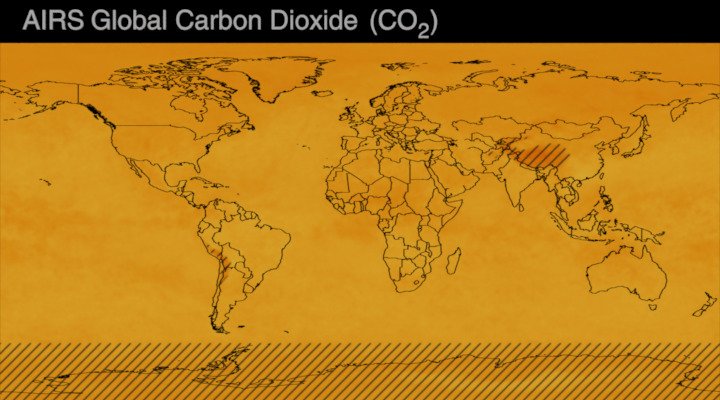
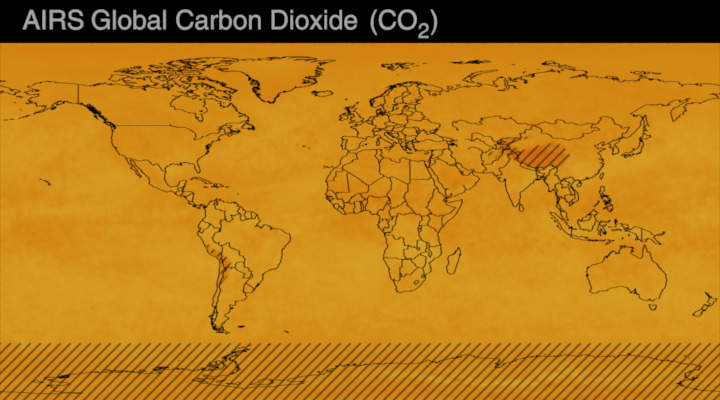
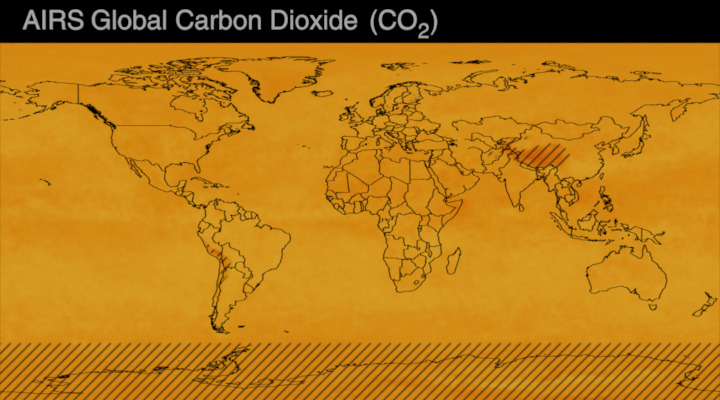
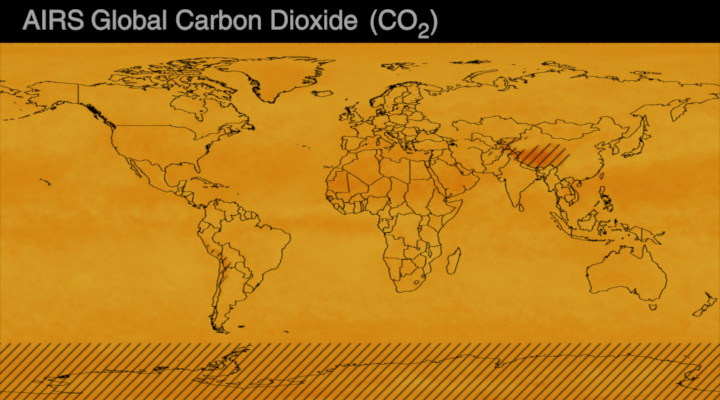
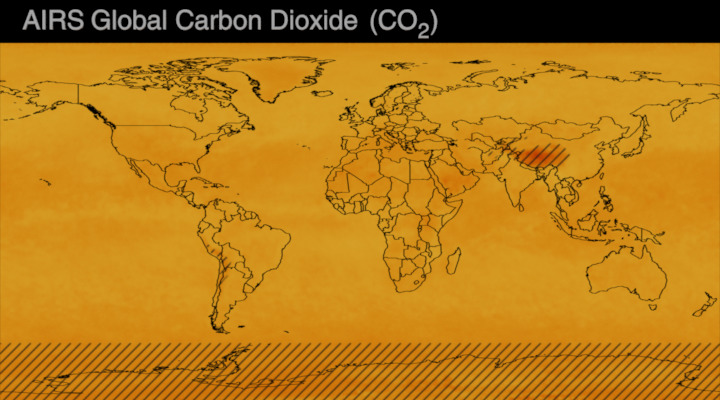
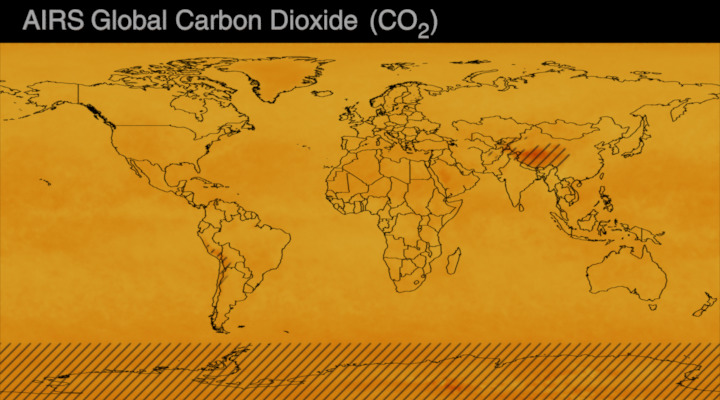
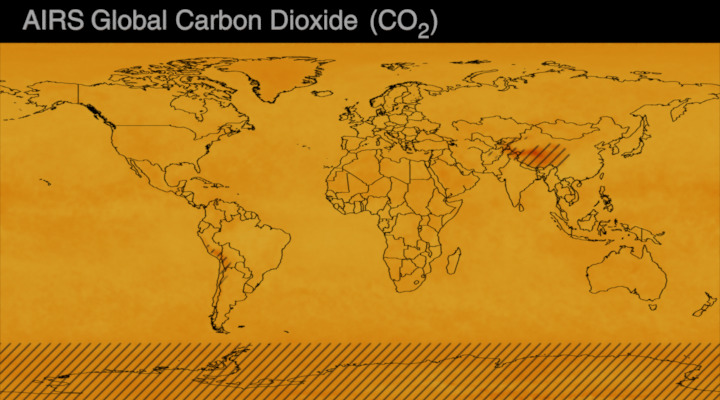
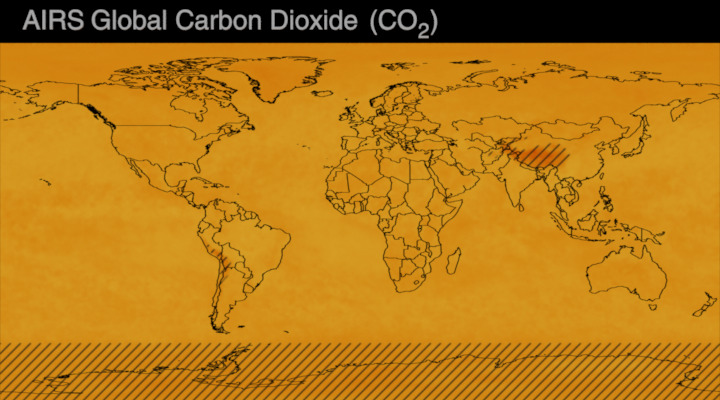
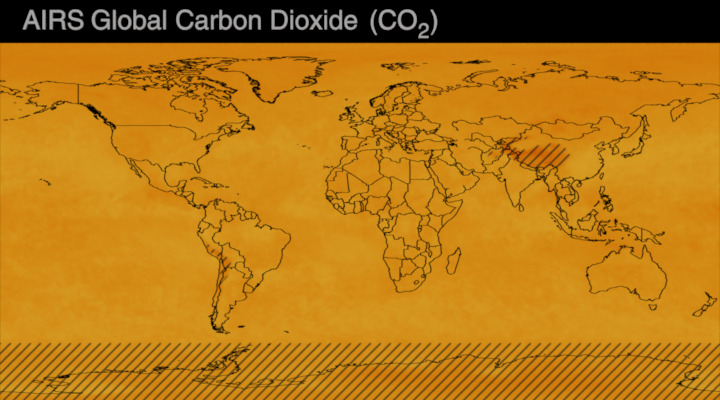
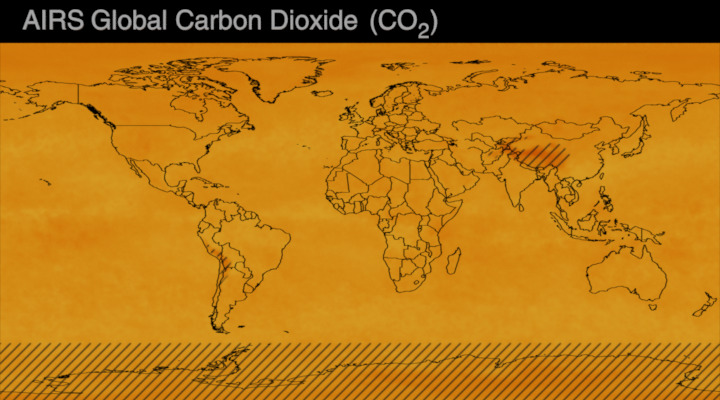
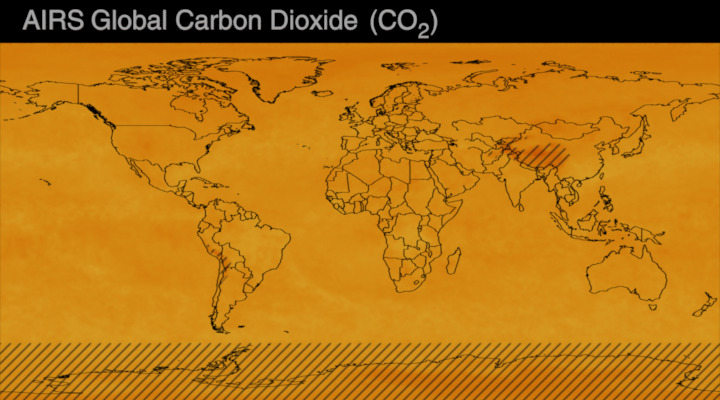
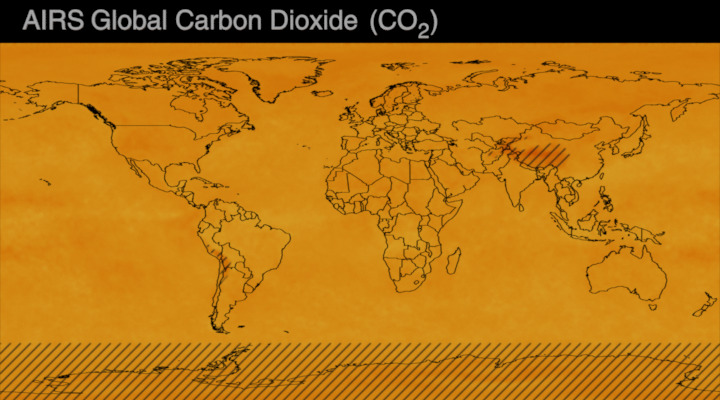
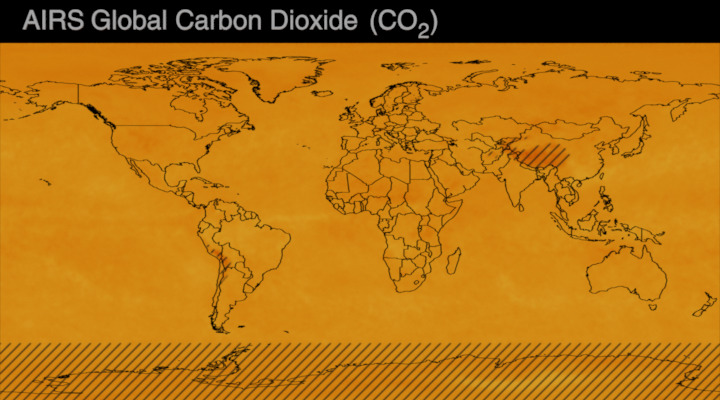
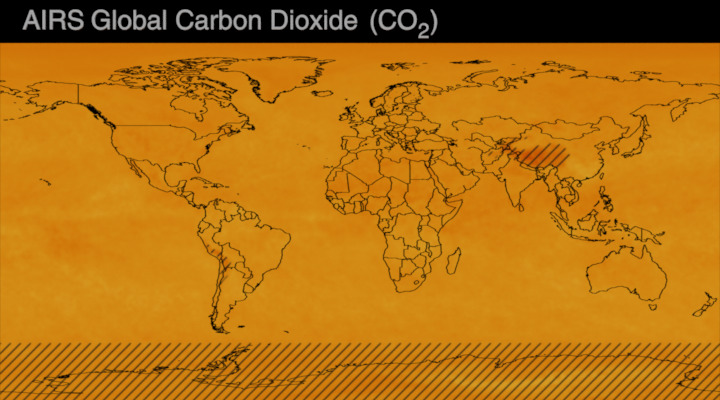
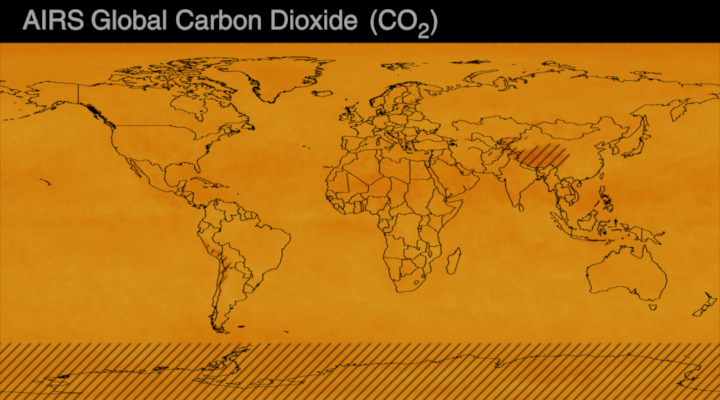
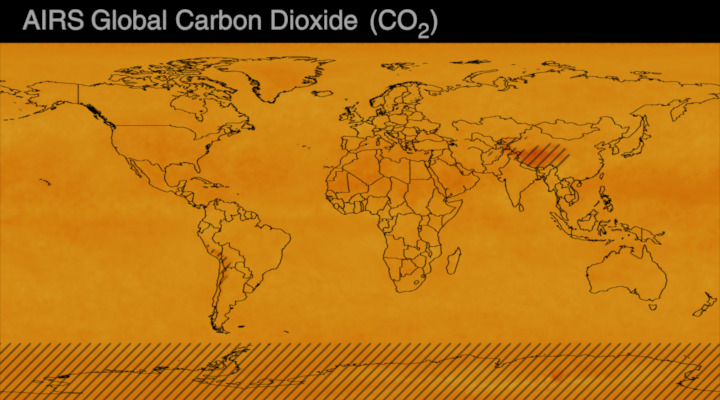
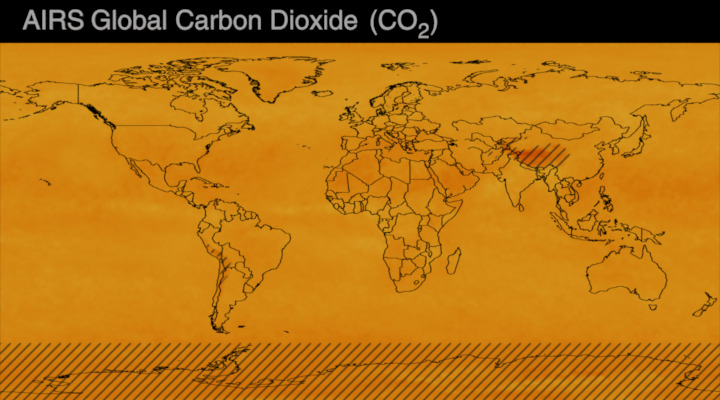
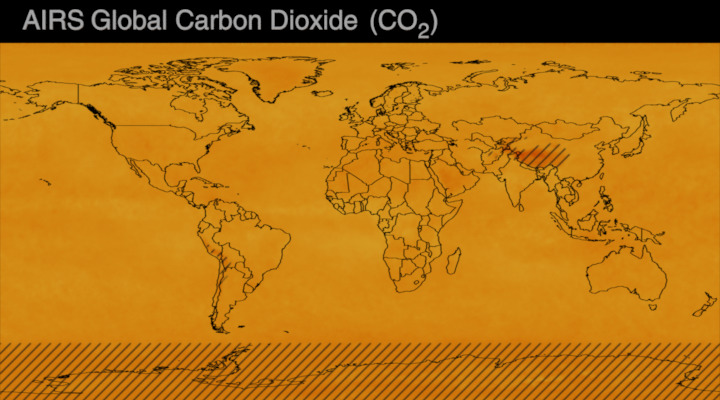
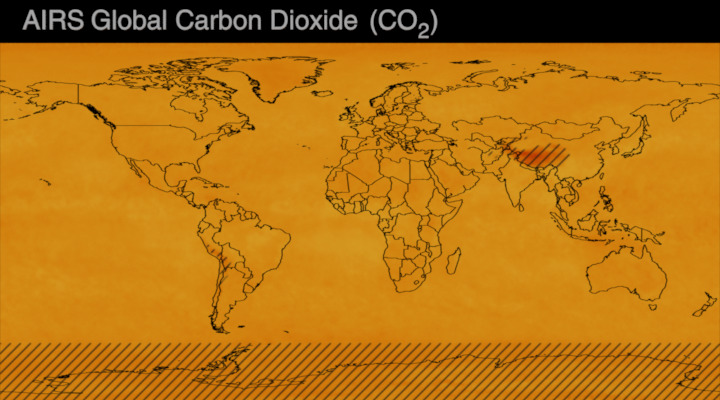
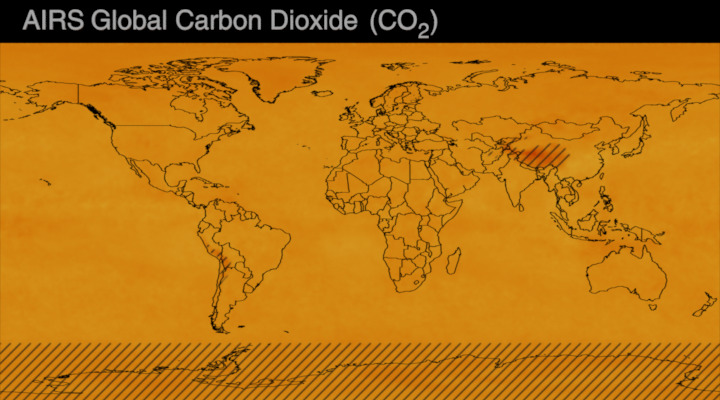
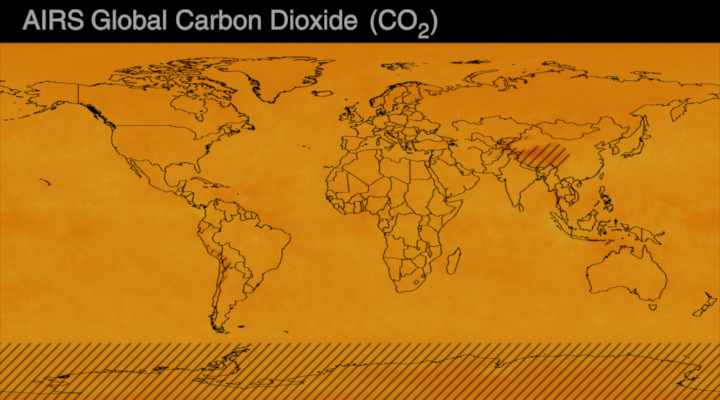
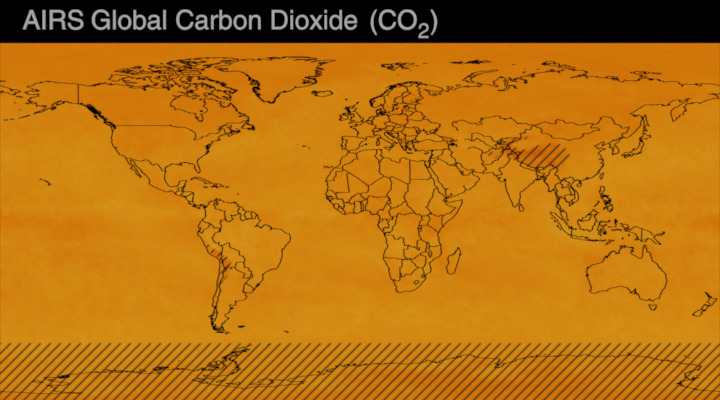
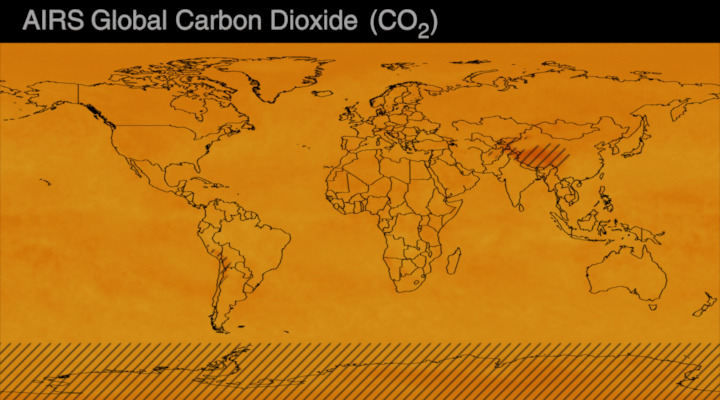
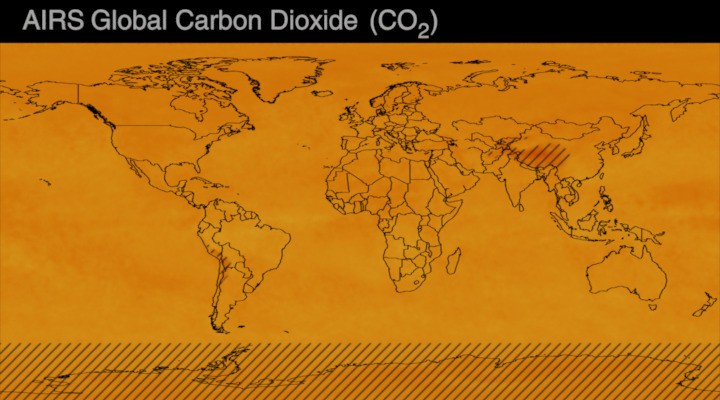
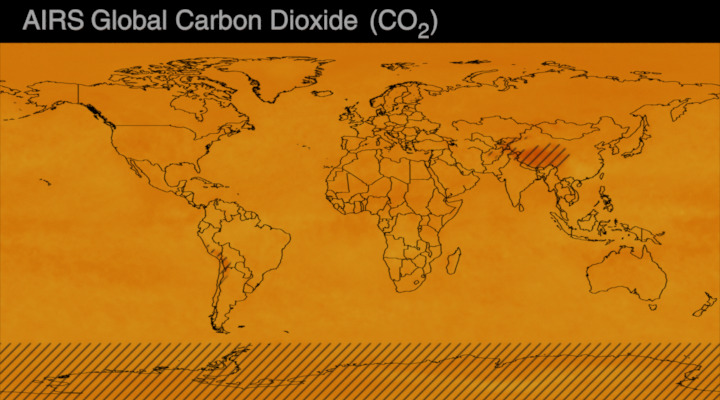
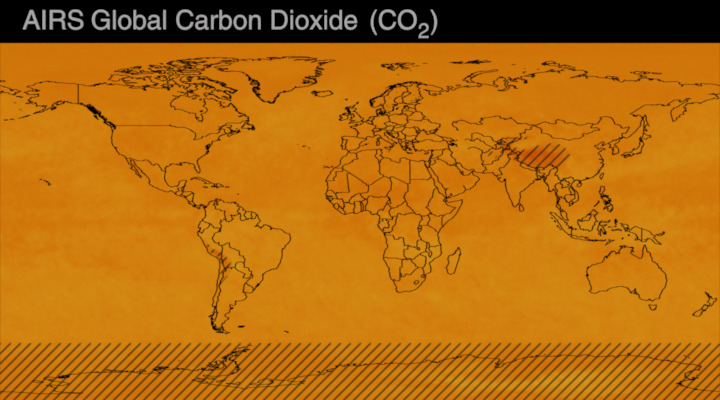
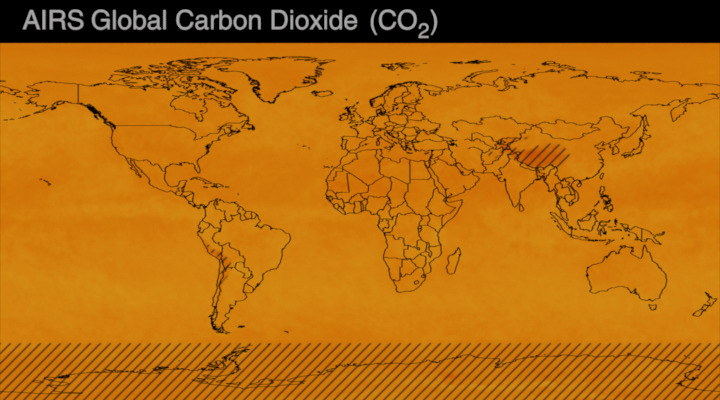
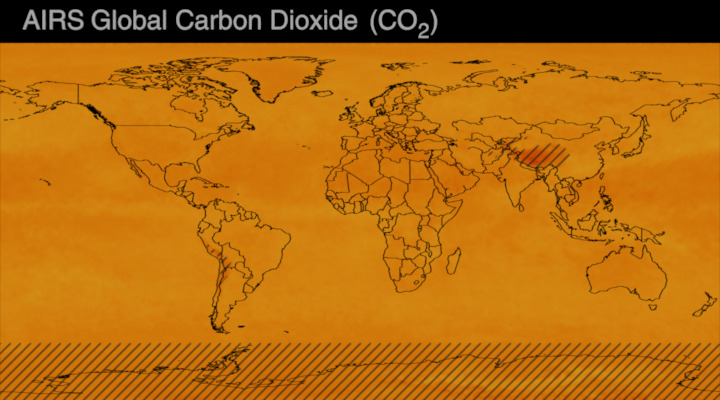
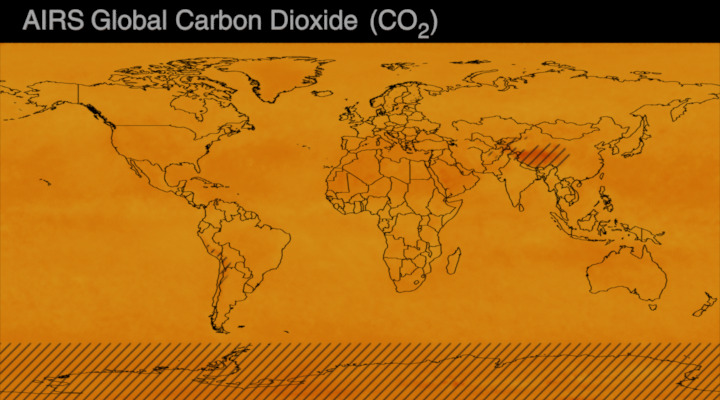
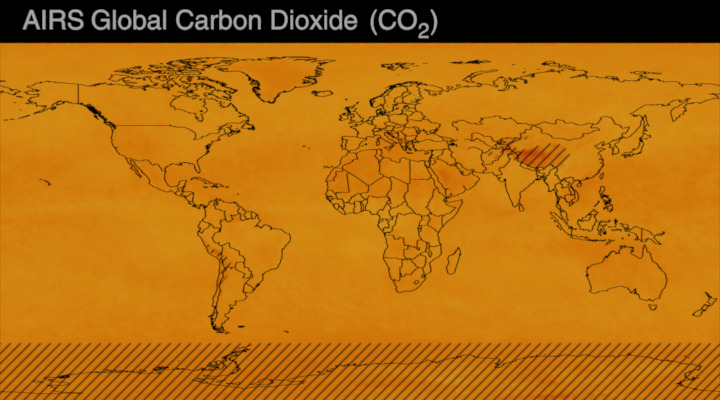
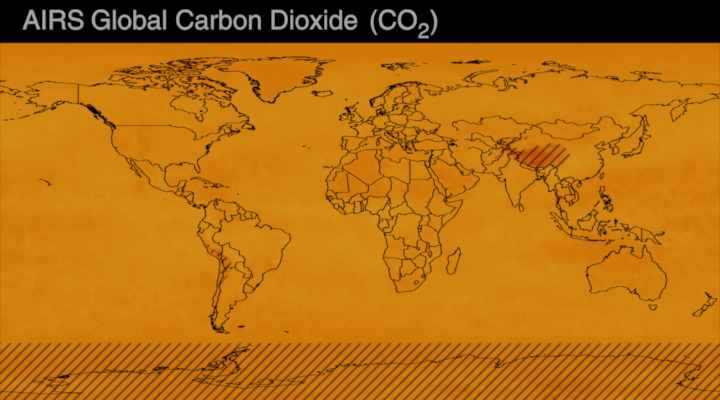
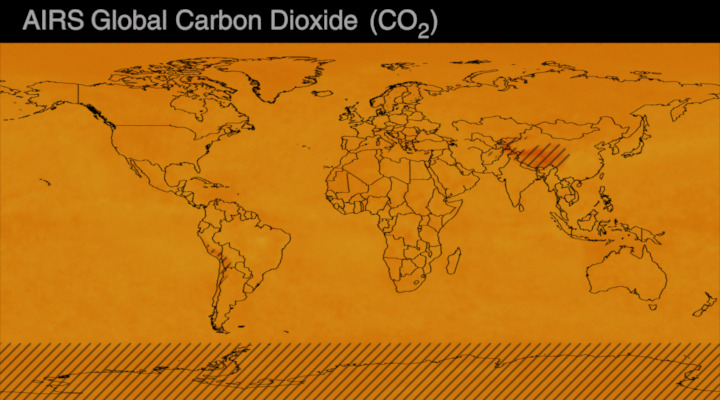
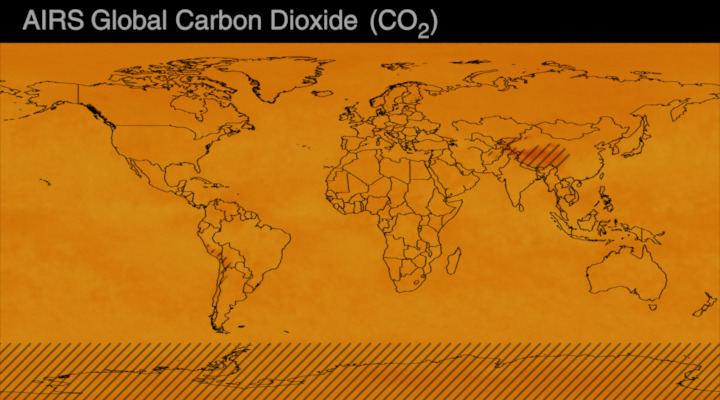
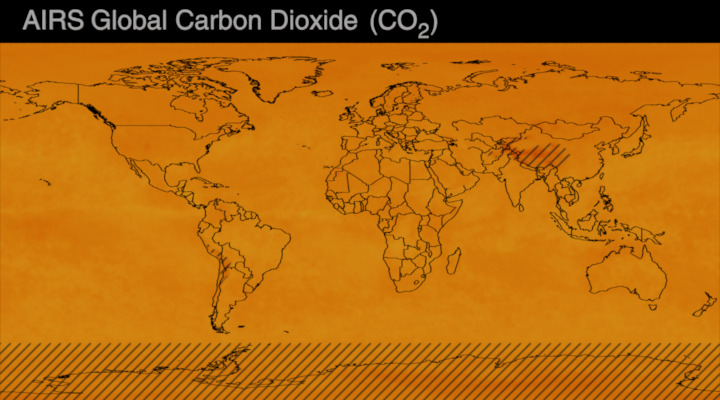
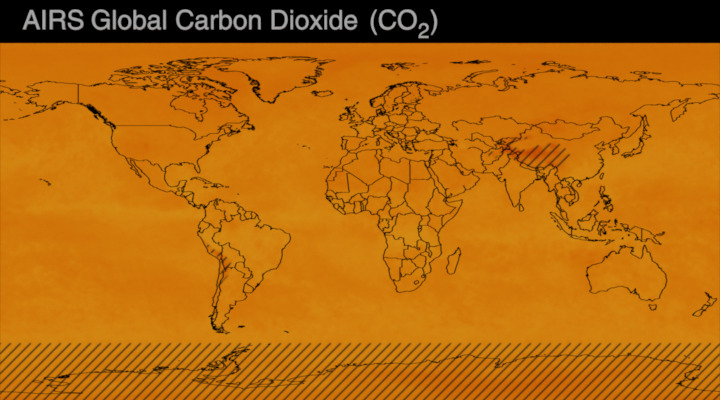
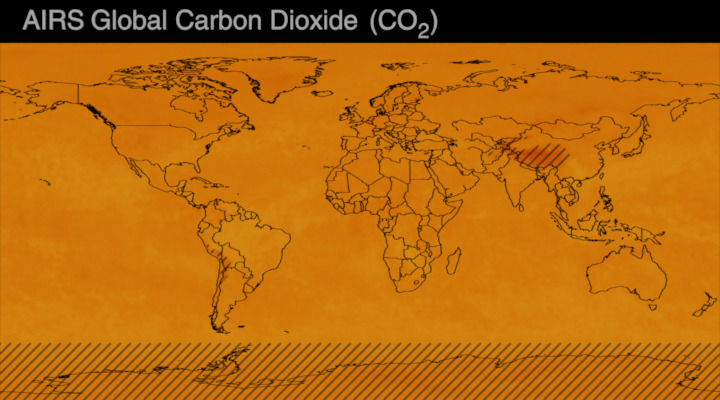
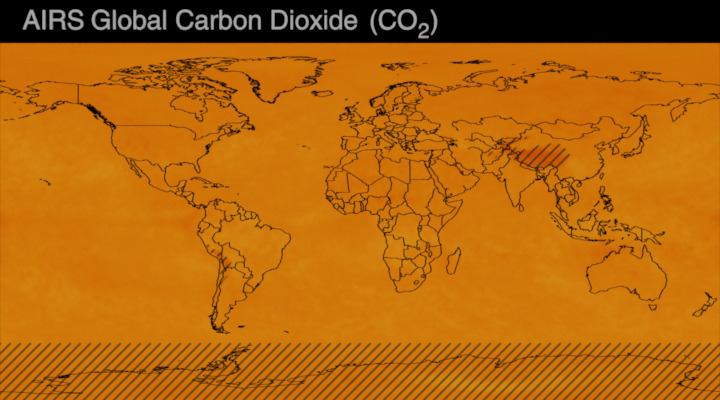
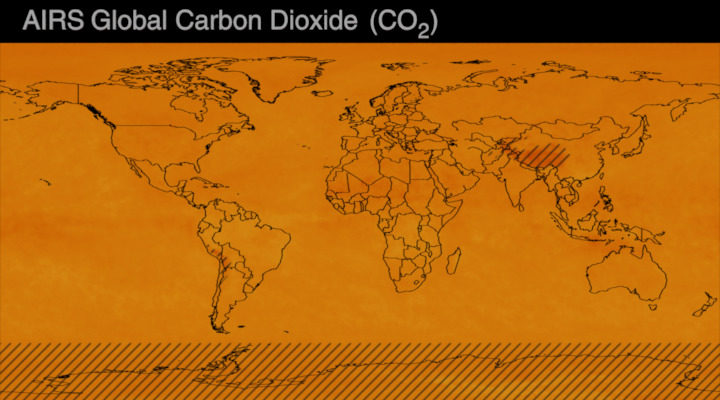
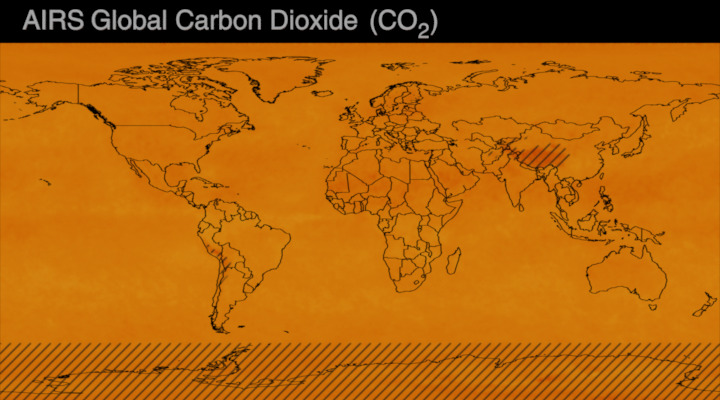
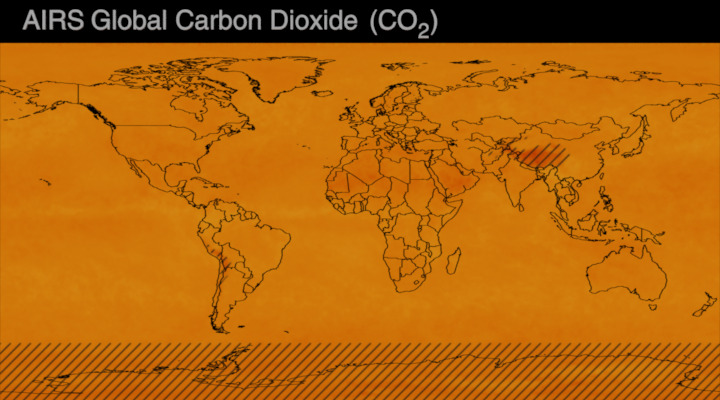
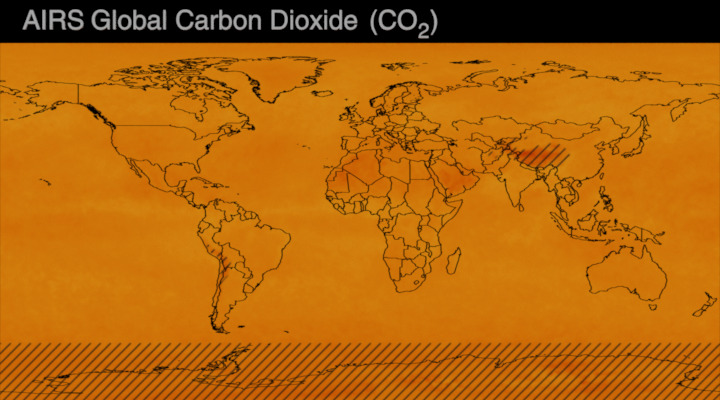
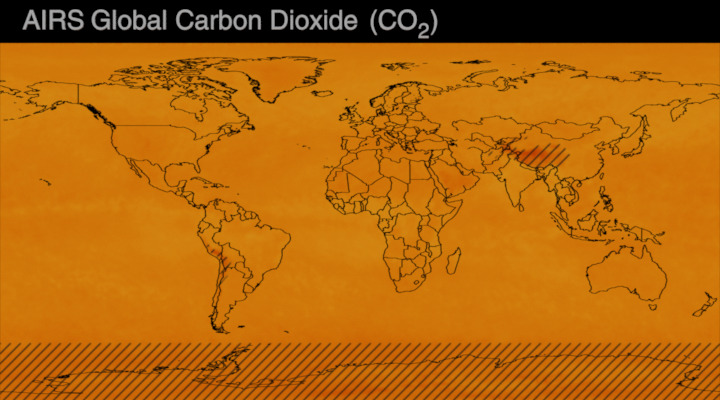
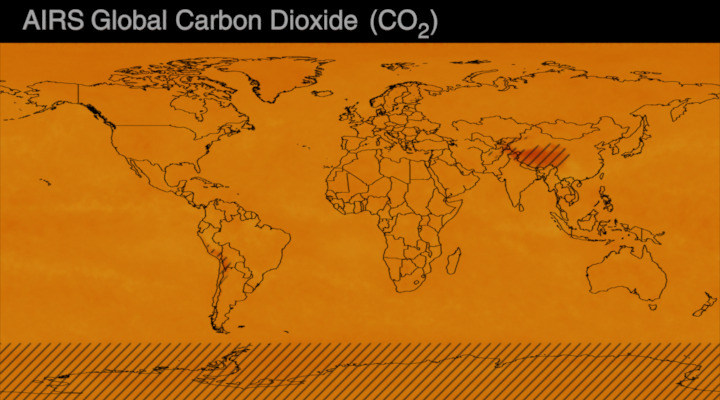
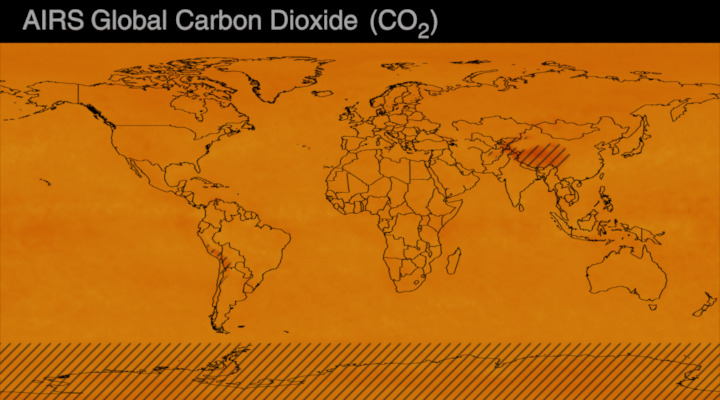
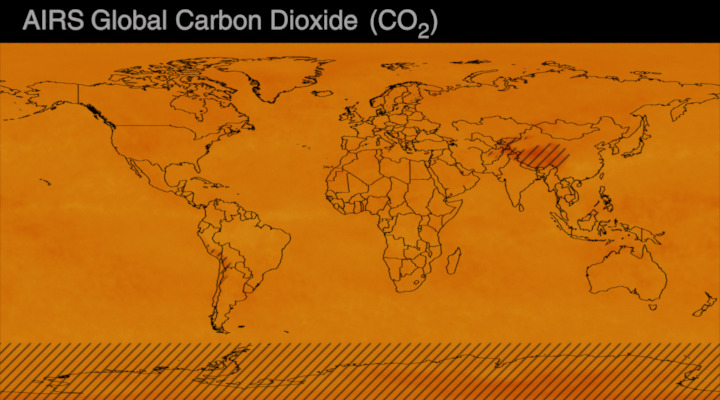
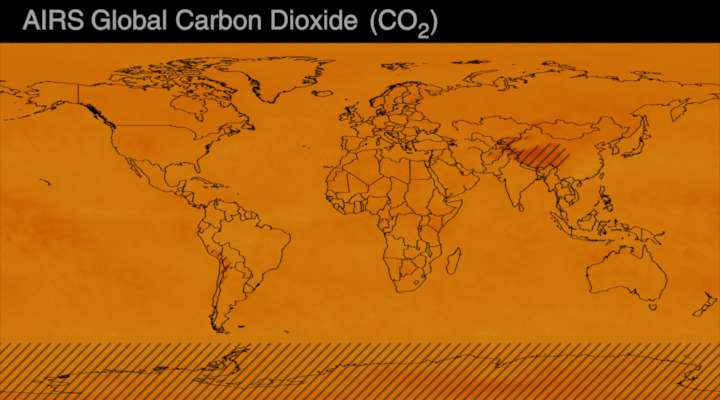
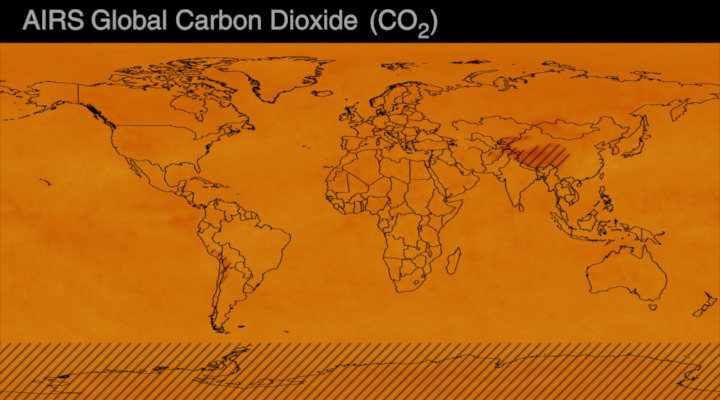
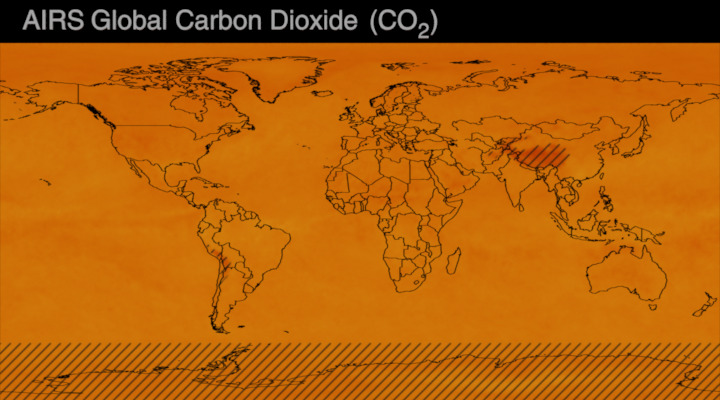
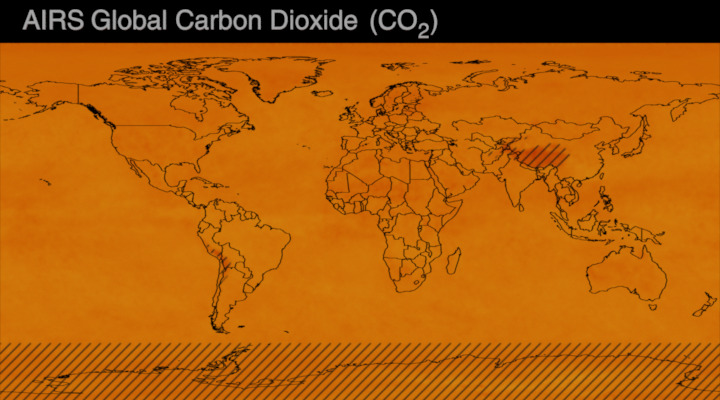
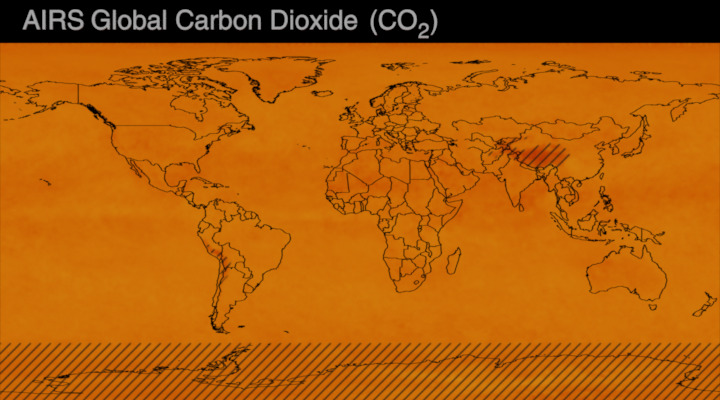
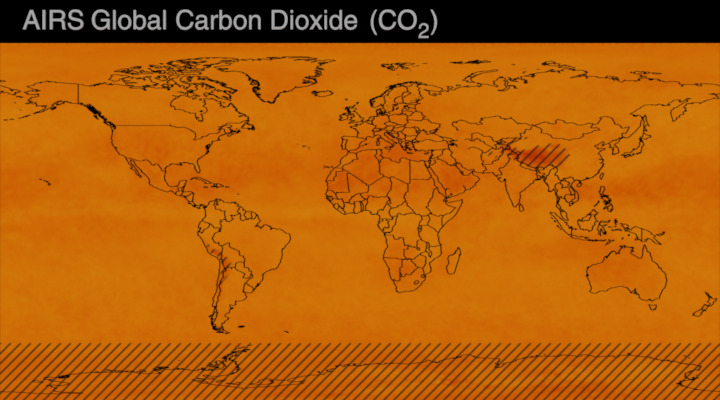
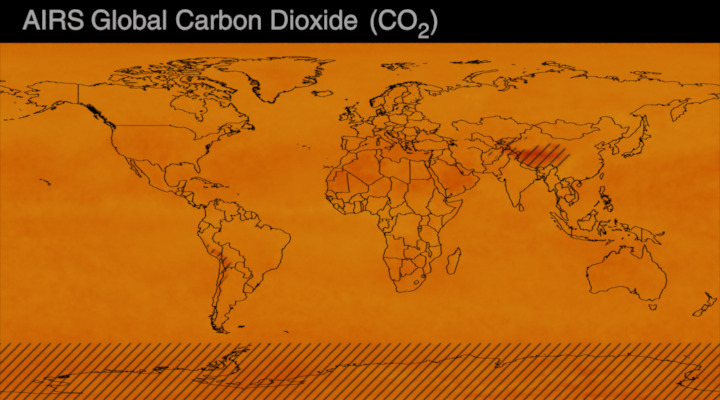
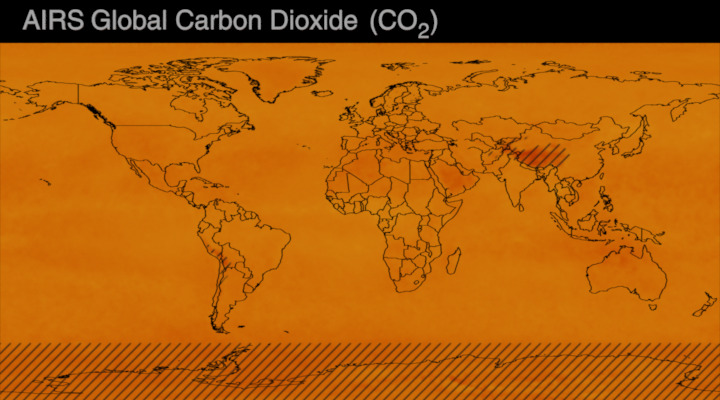
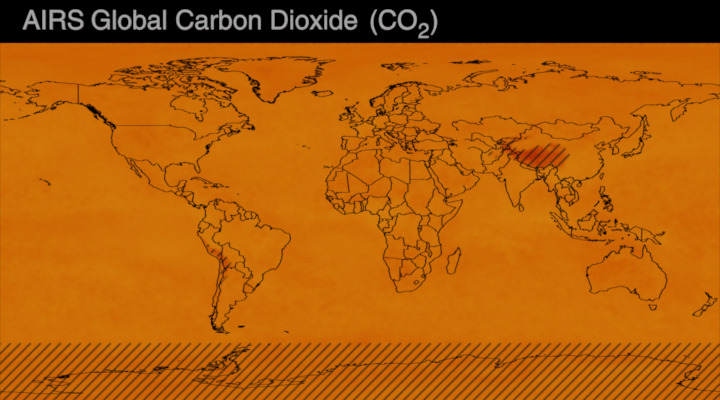
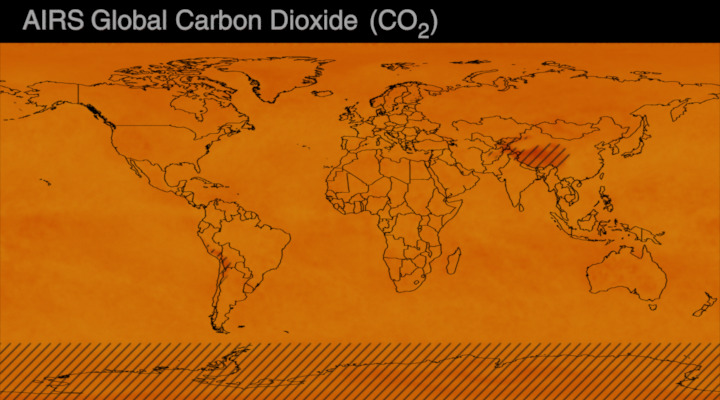
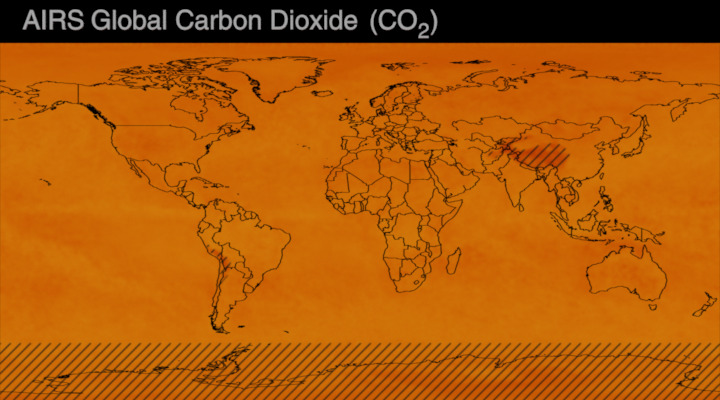
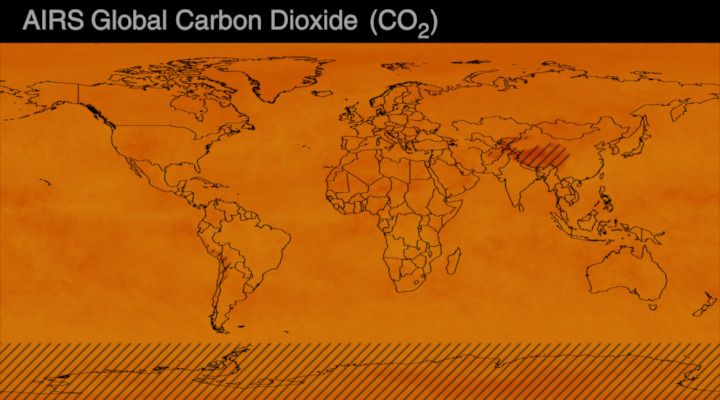
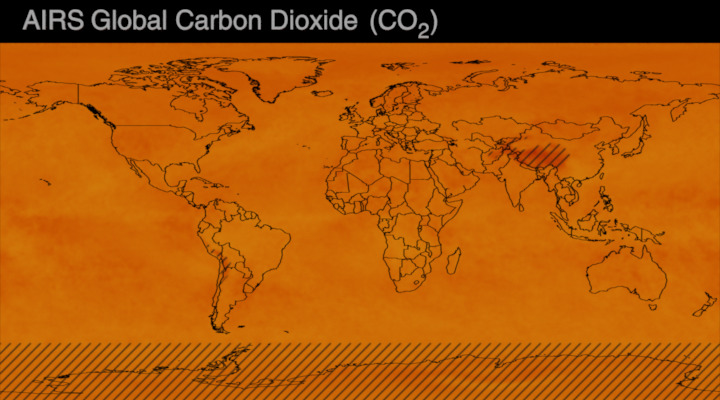
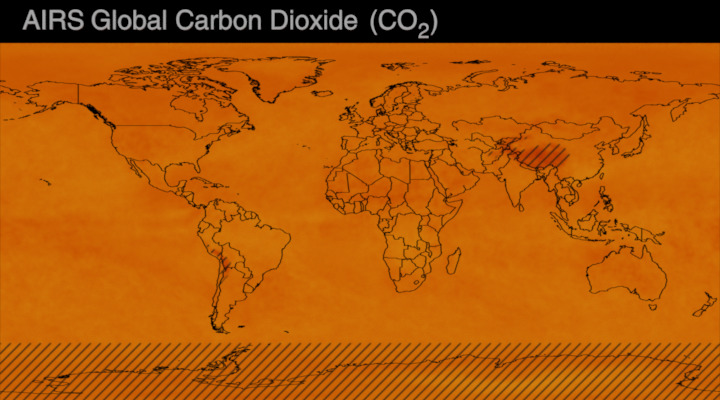
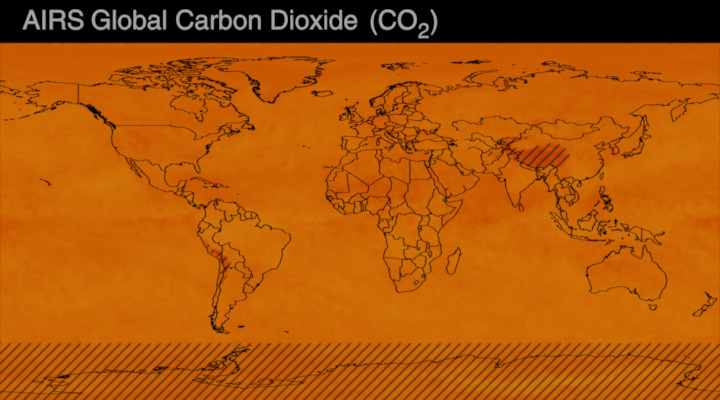
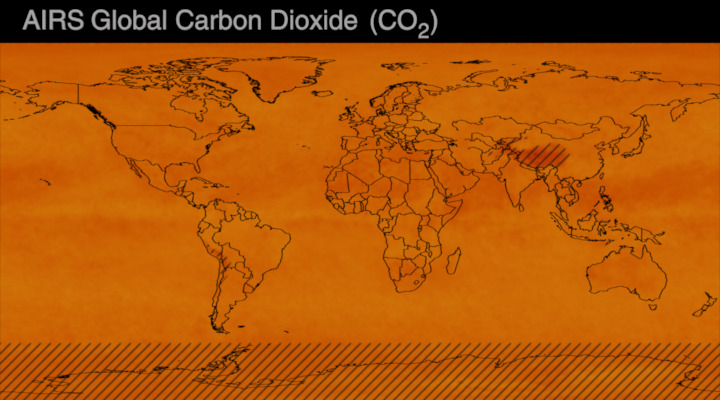
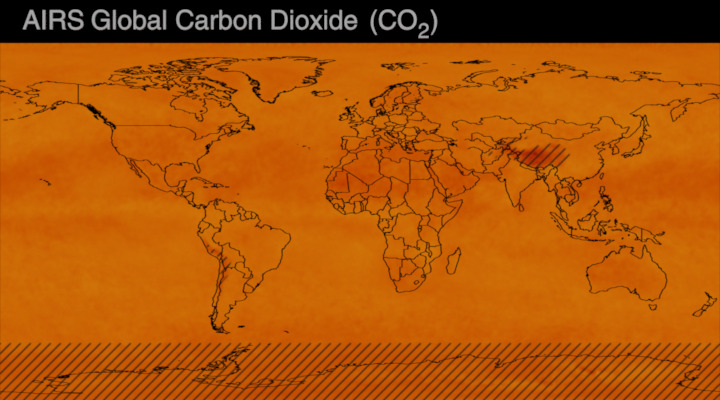
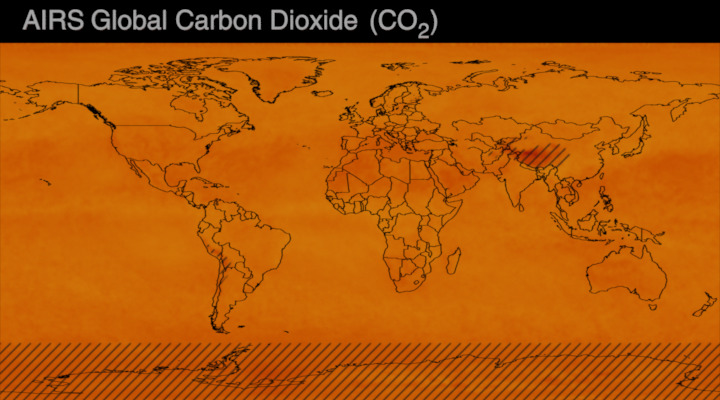
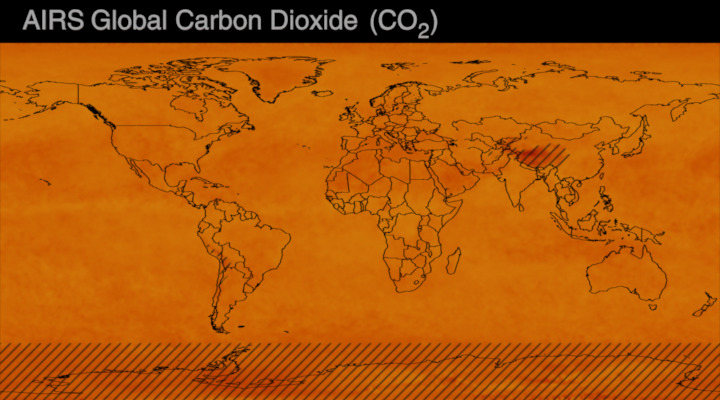
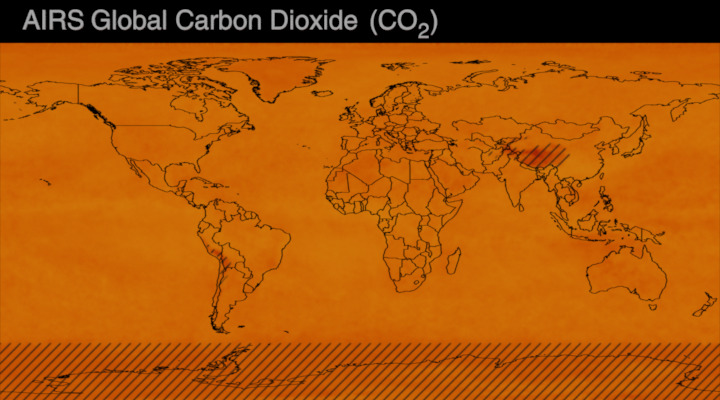
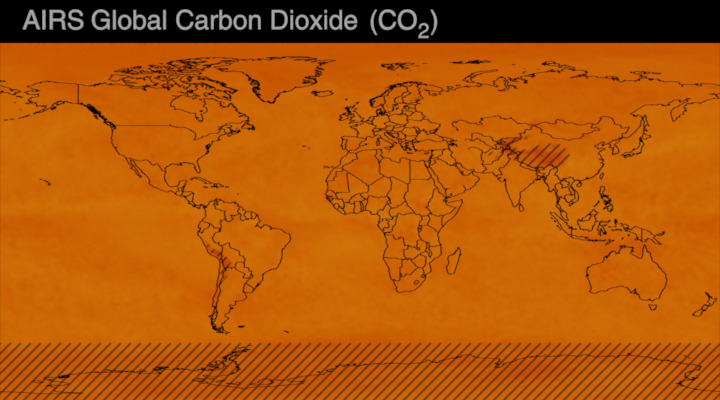
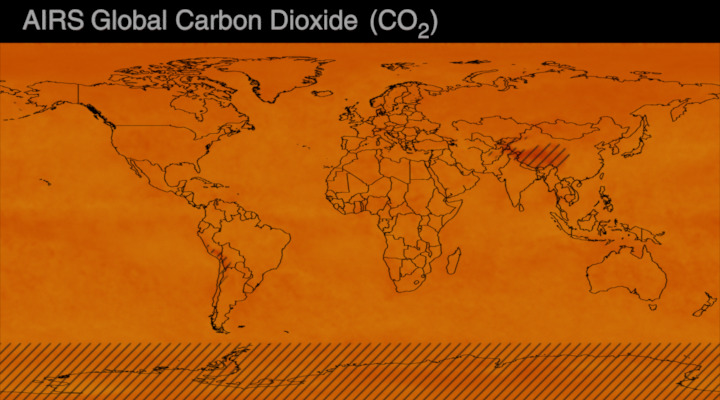
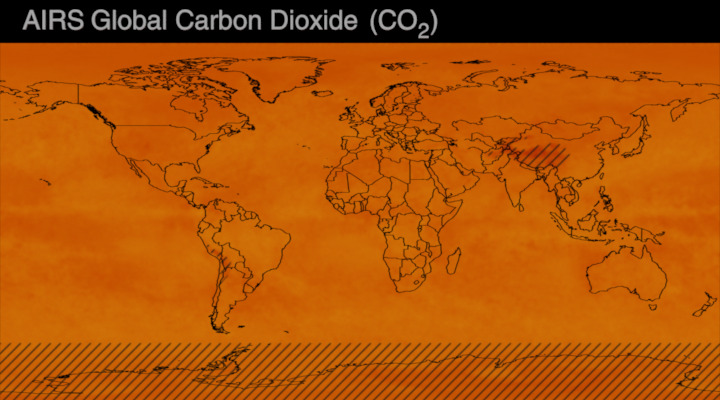
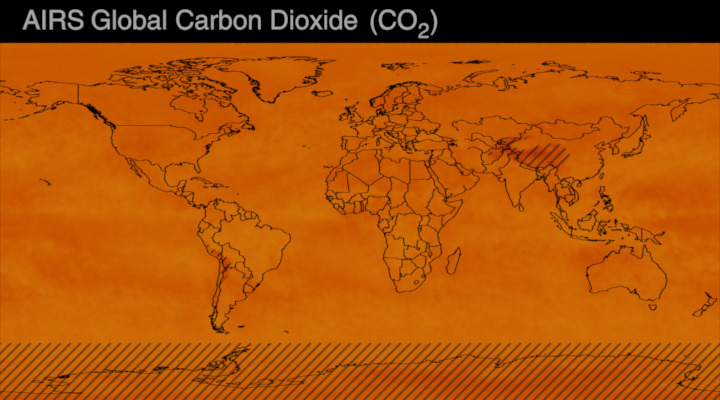
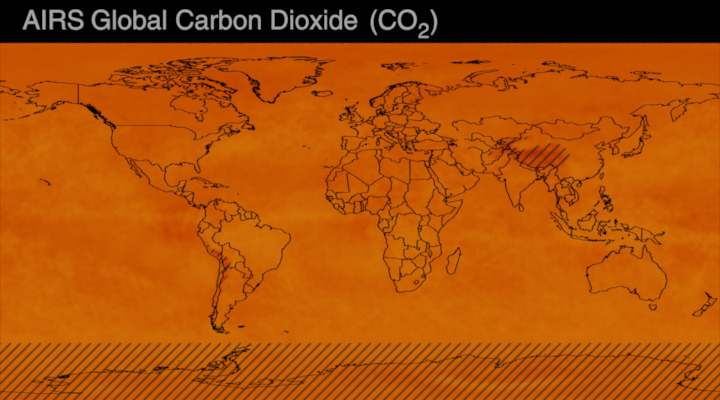
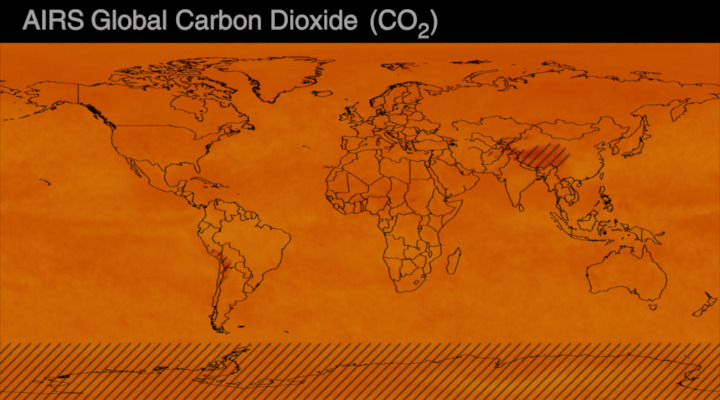
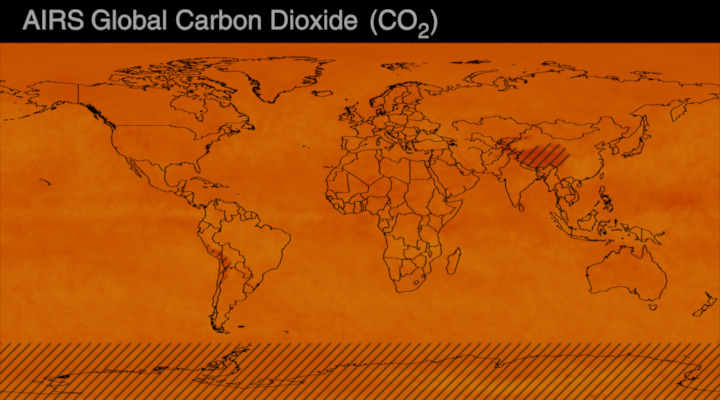
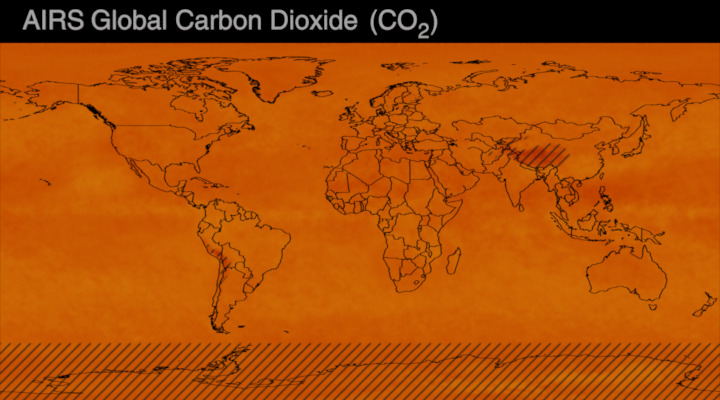
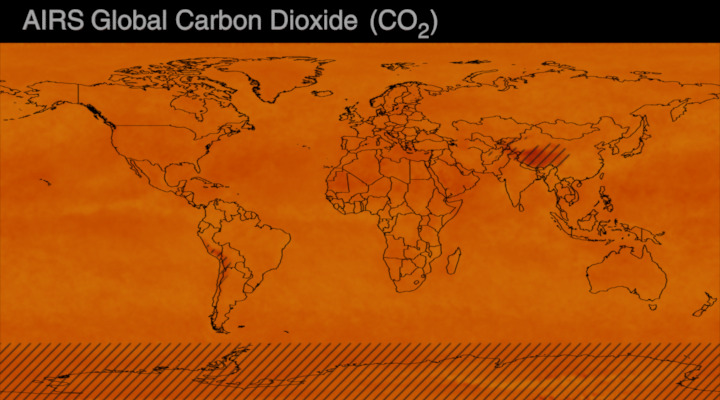
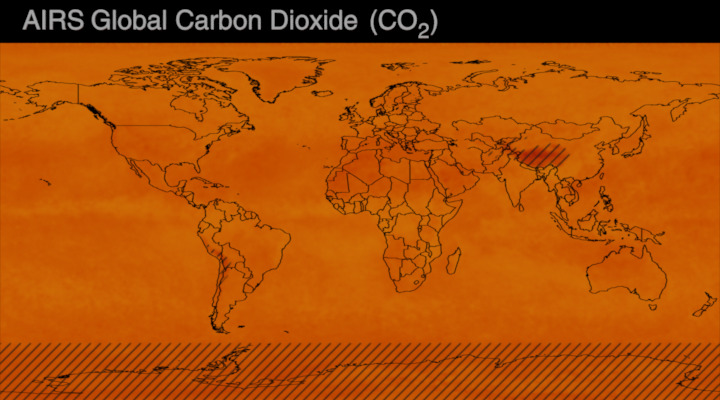
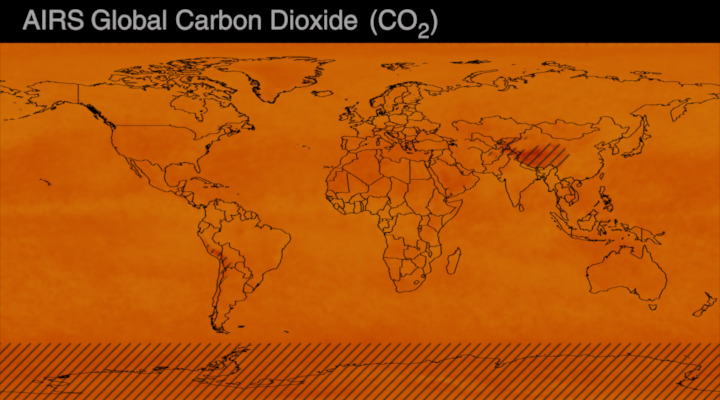
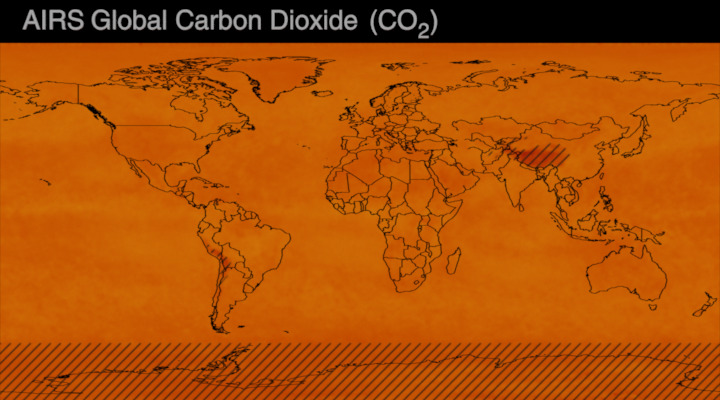
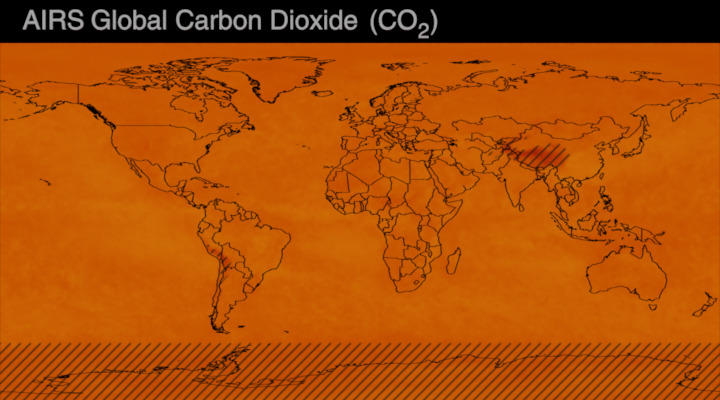
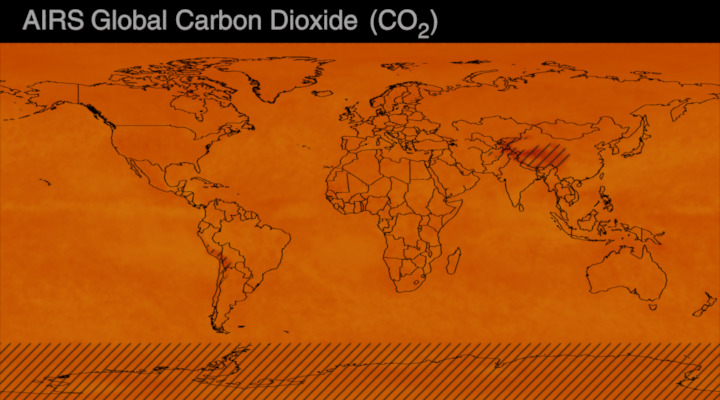
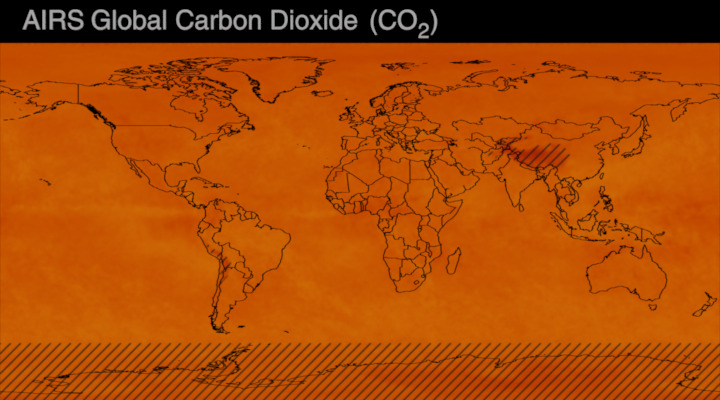
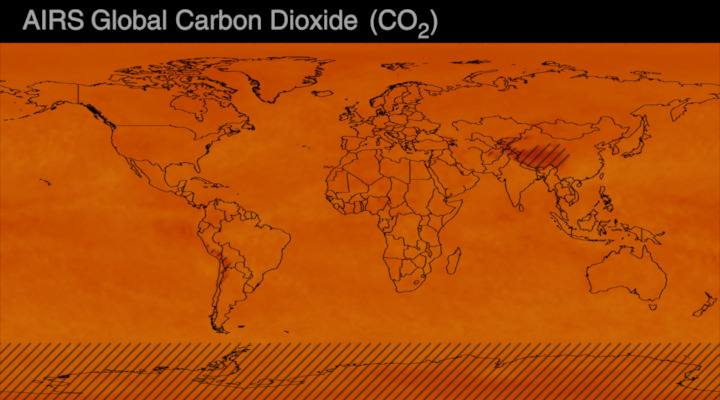
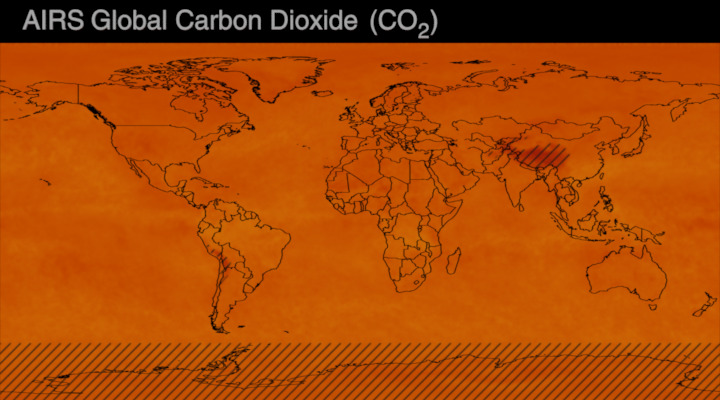
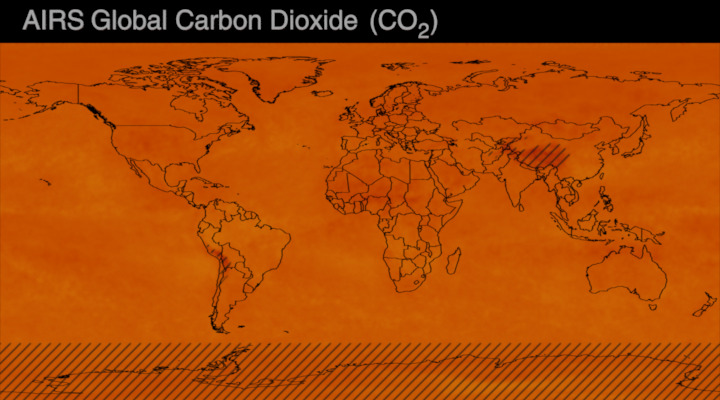
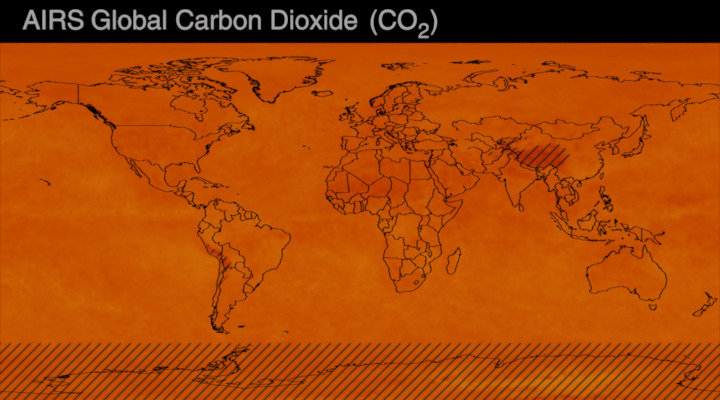
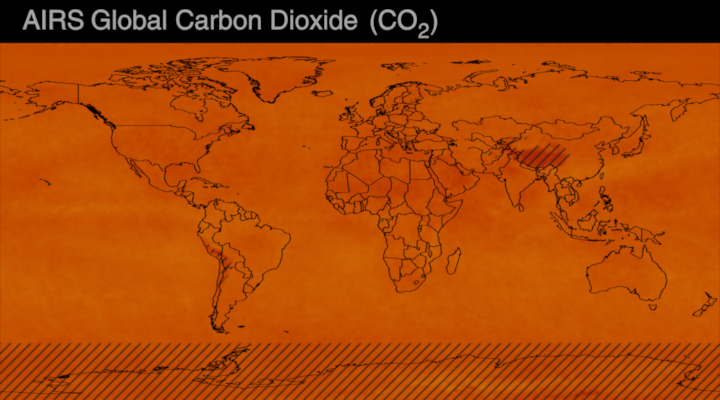
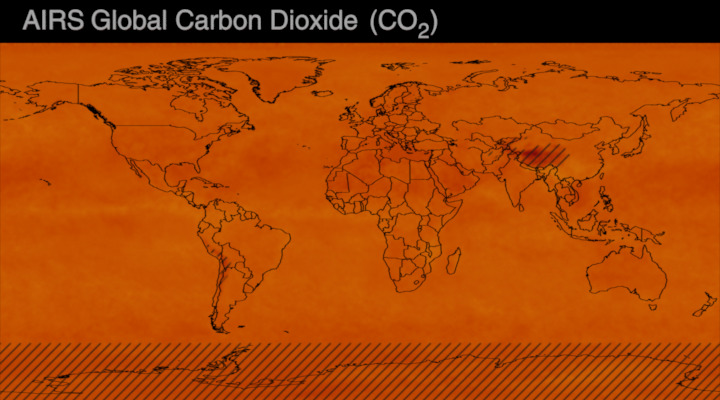
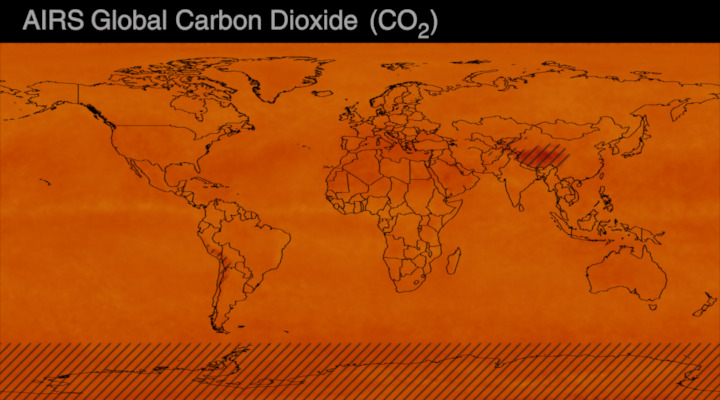
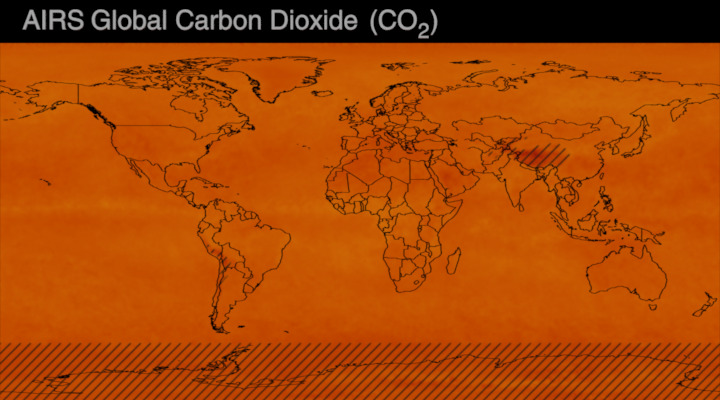
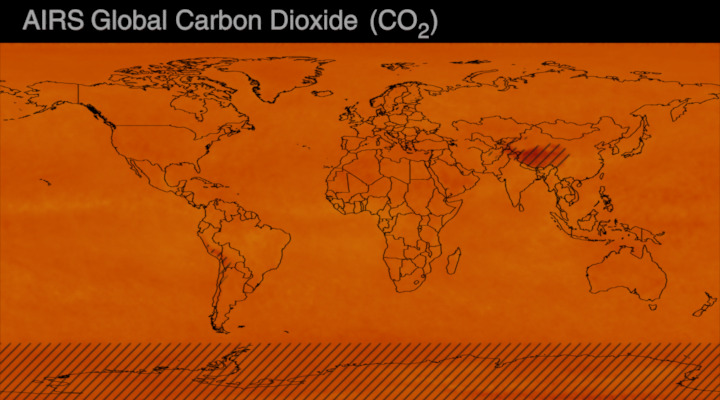
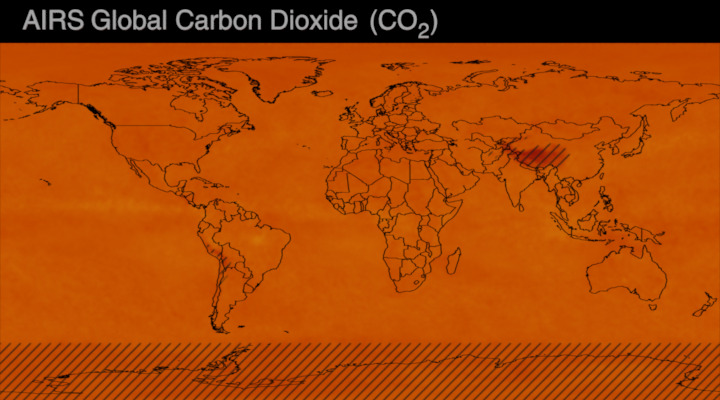
The animated map shows how the historical changes in global carbon dioxide over time. Note the colors change as the amount of CO2 rises from 365 parts per million (ppm) in 2002 to over 420 ppm currently. It's important to understand that “parts per million” refers to the number of carbon dioxide molecules per million molecules of dry air. These measurements are from the mid-troposphere, the layer of Earth's atmosphere that is 8 to 12 kilometers (about 5 to 7 miles) above the ground. This data provides insights into the significant rise in atmospheric CO2 concentrations, highlighting the impact of human activities on Earth's climate.
CO2 Through the Seasons
A closer look at the carbon dioxide measurements at Mauna Loa shows a series of wiggles in the data. Although total CO2 is increasing each year, there is also a short-term cycle visible within the larger trend.
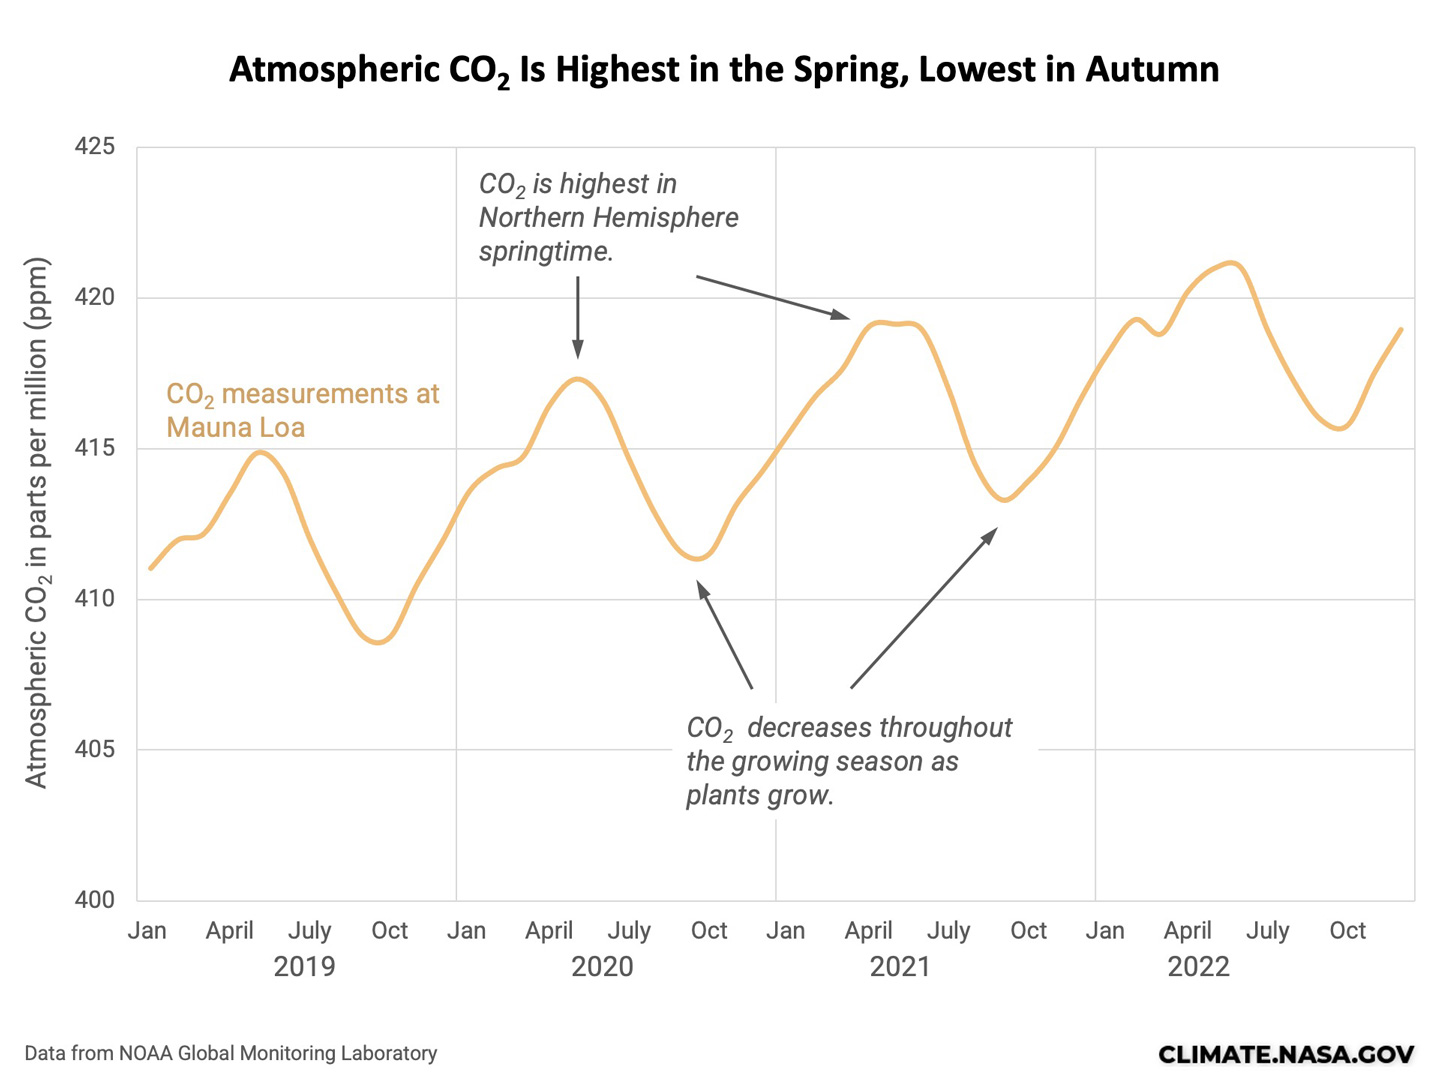
This annual rise and fall of CO2 levels is caused by seasonal cycles in photosynthesis on a massive scale. In Northern Hemisphere spring, plants come to life and draw in CO2 to fuel their growth. This begins the process of lowering the amount of CO2 in the atmosphere. In northern autumn, plant growth stops or slows down, and the whole process reverses itself. Much of the plant matter decomposes, releasing CO2 back to the atmosphere.
A similar but less intense pattern repeats in the Southern Hemisphere in opposite seasons. Spring growth starts in September and winter decomposition begins in March, so CO2 records in the Southern Hemisphere show the opposite pattern of that seen in Mauna Loa. However, because there is a lot more land and vegetation in the Northern Hemisphere than the southern, the global seasonal cycle more closely aligns with the northern pattern.
See the cycle in action in the visualization Watching Earth Breathe: The Seasonal Vegetation Cycle and Atmospheric Carbon Dioxide.
This boom-and-bust cycle of plant growth gives the graph of CO2 a sawtooth pattern of ups and downs from year to year. At a larger scale, the upward climb of the trend line over the decades is caused by CO2 emissions, primarily from burning fossil fuels. Thus, the data illustrate both natural factors and human additions of CO2.
Learn more:
NASA's Climate Kids: Why is Carbon Important?
Missions That Observe CO2
Atmospheric Infrared Sounder (AIRS)
DIRECT MEASUREMENTS: 1958-PRESENT
PROXY (INDIRECT) MEASUREMENTS
Credit: NOAA
Time Series: 2002-2022
Credit: NASA